How to Make Scientific Figures and Illustrations with AI?
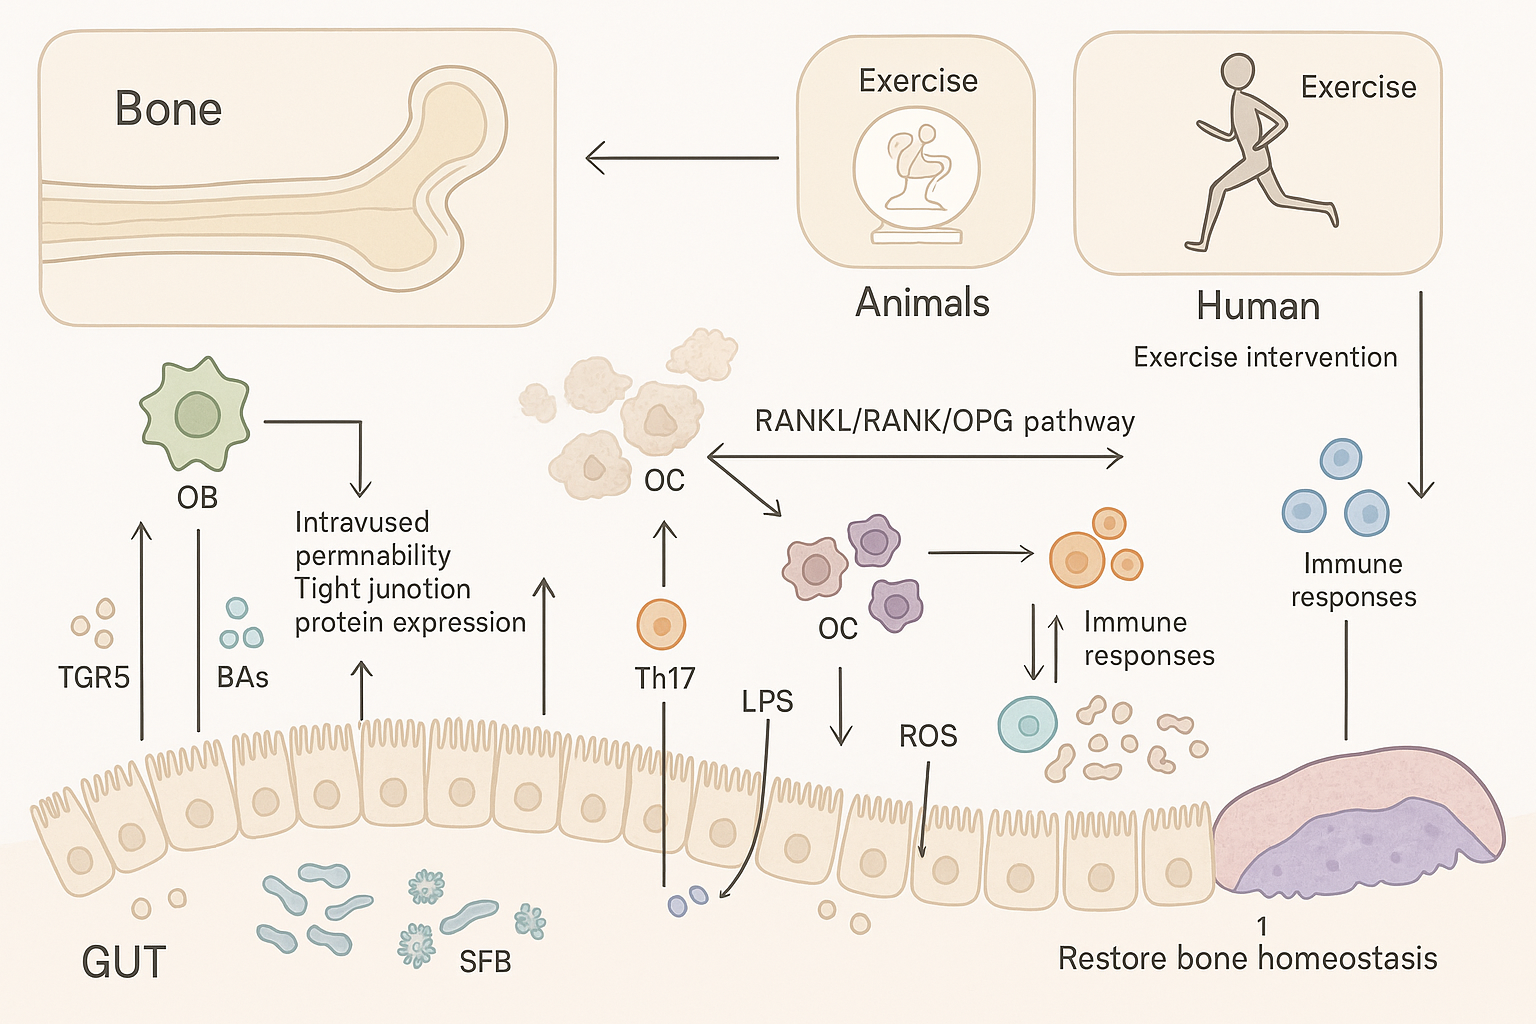
How AI is Revolutionizing scientific infographics: Say Goodbye to Tedium, Welcome Efficiency and Professionalism
In the journey of scientific research, the presentation of data analysis and experimental results is paramount. A clear, professional, and expressive scientific illustration not only intuitively conveys complex information but is also a key factor in whether a paper can be successfully published. However, for many scientists and researchers, scientific illustration often means a time-consuming, high-threshold challenge. From hand-drawn sketches to publication-ready images, every step can be filled with tedium and frustration.
But now, with the rapid development of artificial intelligence (AI) technology, this situation is being completely changed. The emergence of AI scientific illustration tools is revolutionizing the field of scientific visualization in an unprecedented way, allowing researchers to bid farewell to the pain points of traditional drawing and embrace a new experience of efficiency and professionalism. Among them, FigureLabs, as a fully AI-driven scientific illustration software, is leading this revolution.
The Pain Points of Traditional Scientific Illustration: Why is it so "Difficult to Produce"?
Before the advent of AI solutions, researchers often faced numerous difficulties in the process of research chart creation:
1.High Time Cost: Learning and mastering professional drawing software (such as Adobe Illustrator, Photoshop, etc.) requires a lot of time, and the operation is complex, consuming the precious energy of researchers.
2.High Design Threshold: Researchers who lack a professional design background find it difficult to independently complete beautiful and standardized publication-ready images, often needing to seek help from professional designers, which increases communication costs and the risk of delays.
3.Disconnection between Data and Graphics: In the process of converting experimental data into charts, manual operations are prone to errors, and it is difficult to achieve dynamic data updates.
4.Inconsistent Image Quality: Even if completed, the clarity, color scheme, and layout of the images may not meet the requirements of the journal, leading to repeated revisions or even rejection.
5.Repetitive Work: Similar chart types need to be drawn repeatedly, resulting in low efficiency.
These traditional drawing pain points have undoubtedly become a "stumbling block" to scientific output and communication.
The Application of AI in academic figure creation: How FigureLabs Provides an AI Solution?
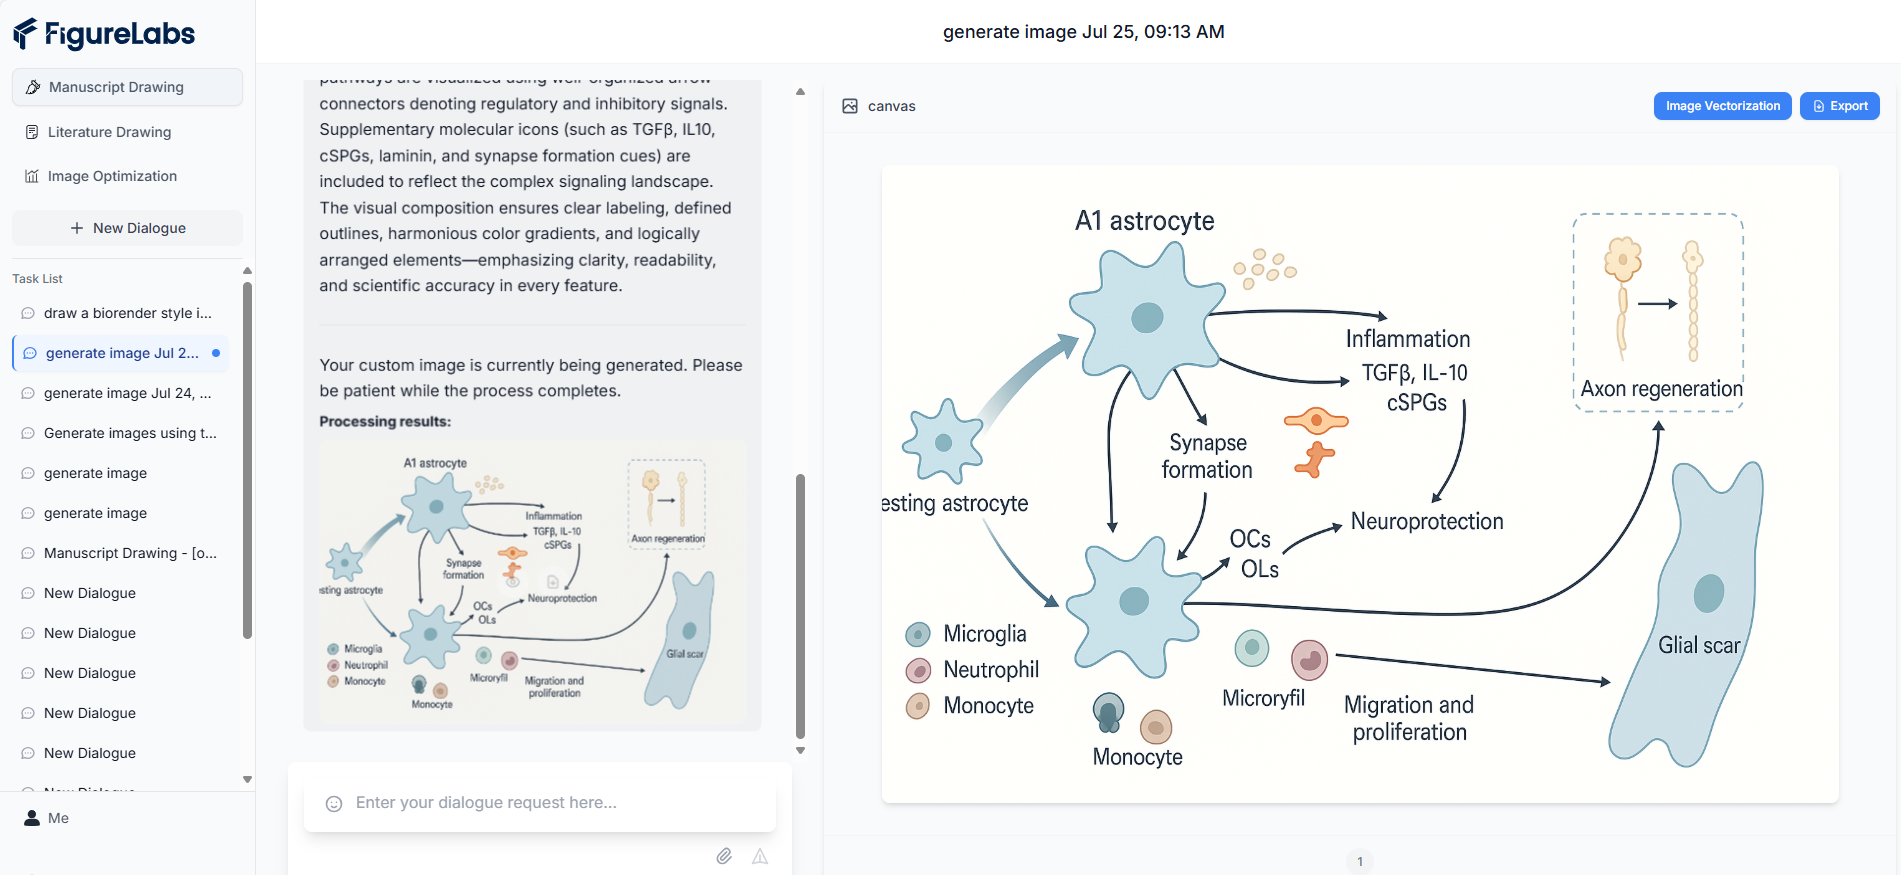
The application of AI in scientific research is becoming more and more widespread, and FigureLabs is an outstanding representative of this trend in the field of scientific illustration. It provides researchers with a one-stop AI-assisted scientific illustration solution through advanced AI technologies such as deep learning, natural language processing, and computer vision. The core advantage of FigureLabs lies in its "fully AI-driven" concept, which means that from data analysis to graphic generation, and then to image optimization, everything is automatically completed by intelligent algorithms.
1. Intelligent Recognition and Automated Generation
Its intelligent recognition can transform your hand-drawn sketches into professional, accurate scientific images, streamlining the process and eliminating the need for complex design software. Simply input or scan your sketch, and the AI will generate a polished, journal-ready visual, saving you time.
2. Efficient Chart Creation and Optimization
Whether it is the complex requirements of biology drawing software or the refined requirements of medical illustration AI, FigureLabs can easily handle them. It has a rich library of templates and intelligent color schemes to ensure that the generated charts are not only accurate but also in line with academic standards and aesthetic standards. For existing images, its "Image Optimization" function can automatically perform clarity enhancement, color correction, and noise reduction to ensure that every image is a high-quality publication-ready image.
3. Flexible Customization and Iteration
Although it is AI-driven, FigureLabs still provides a high degree of customization options. Researchers can adjust the style, color, font, etc. of the chart according to their own needs to ensure that the final result meets personal preferences and journal requirements. This combination of intelligence and flexibility makes intelligent chart generation no longer a cold machine operation, but a powerful assistant for researchers.
FigureLabs: The Future of Improving the Efficiency of Scientific Illustration
The emergence of FigureLabs marks a new era in scientific illustration. It is not just a paper illustration AI tool, but also an innovative platform that can improve the efficiency of scientific illustration and liberate the productivity of researchers. By handing over the tedious drawing work to AI, scientists can devote more energy to experimental design, data analysis, and scientific thinking, thereby accelerating the research process and pushing the boundaries of knowledge.
We believe that FigureLabs will become an indispensable tool for every scientist and researcher, making high-quality scientific visualization accessible and truly realizing the vision of "what you see is what you publish".