
AI Scientific Plot Maker
Turn your stats into journal-quality data visualizations instantly.
Turn your raw data into publication-ready plots
1 of 10
3 steps to create your scientific plot
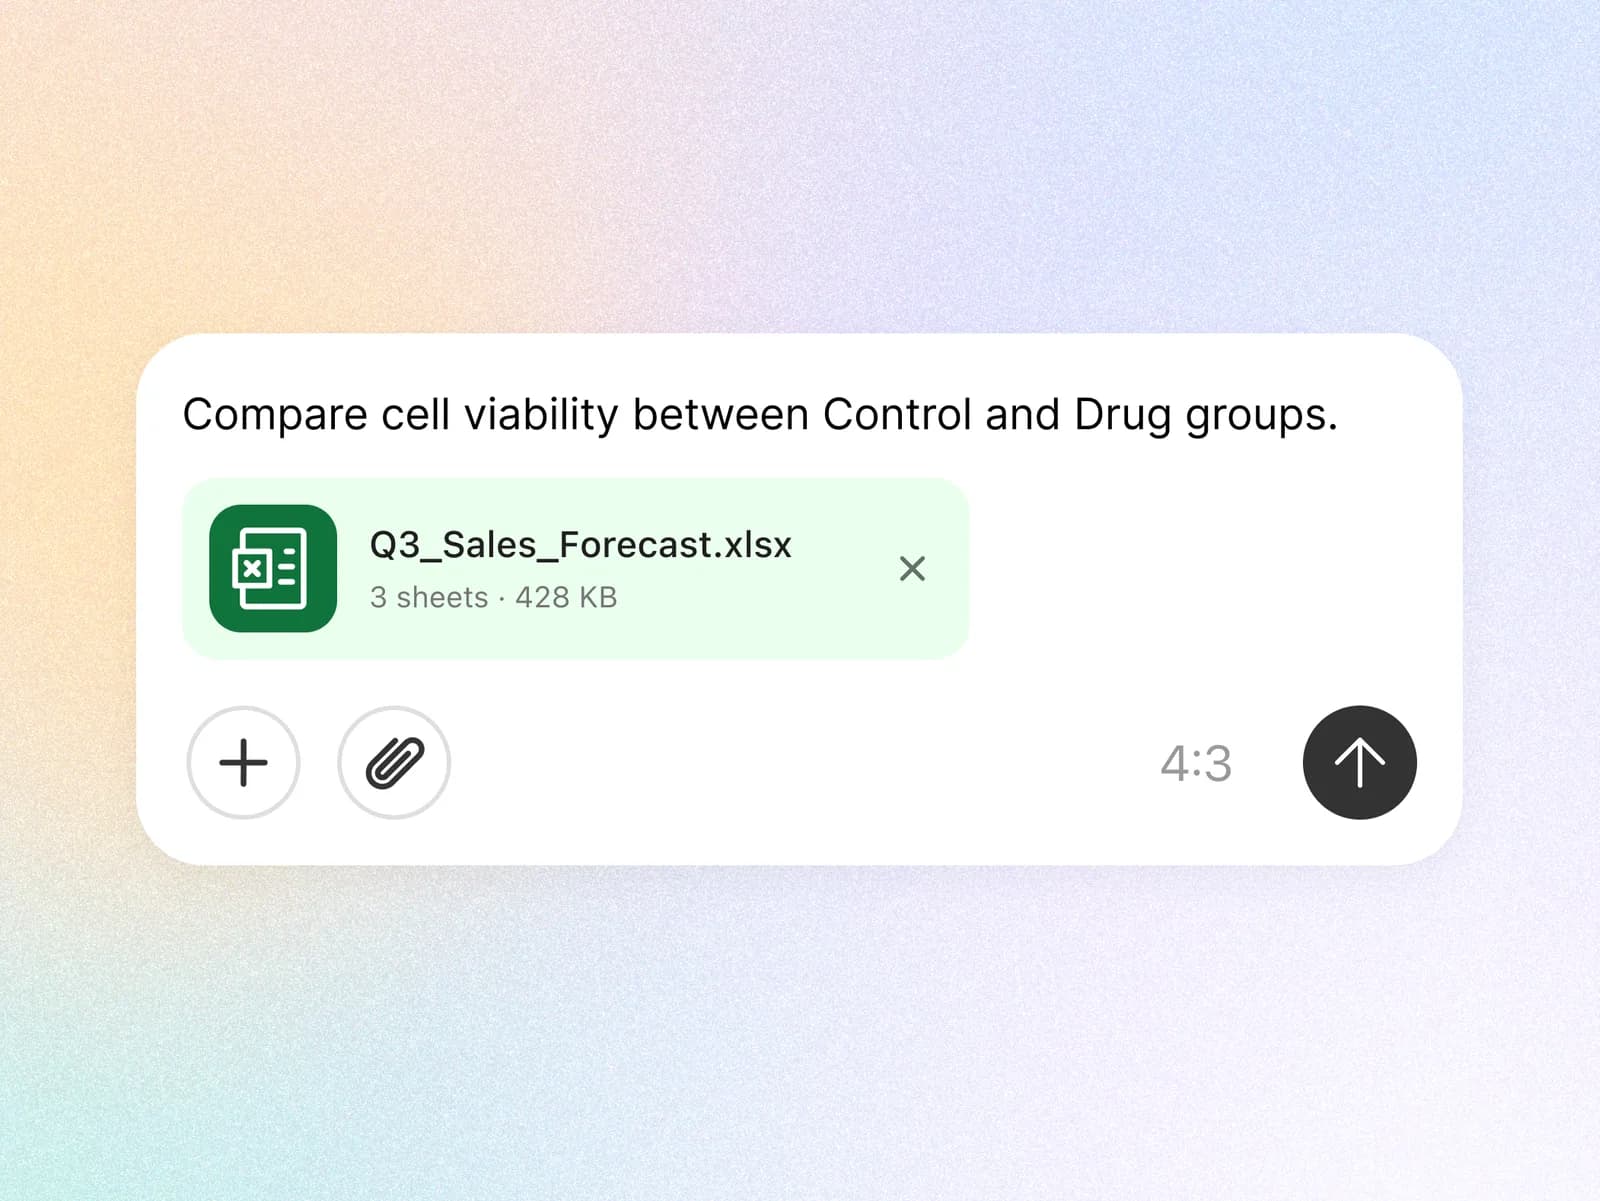
01. Generate
Upload Excel files or paste data directly — get a Nature-style plot.
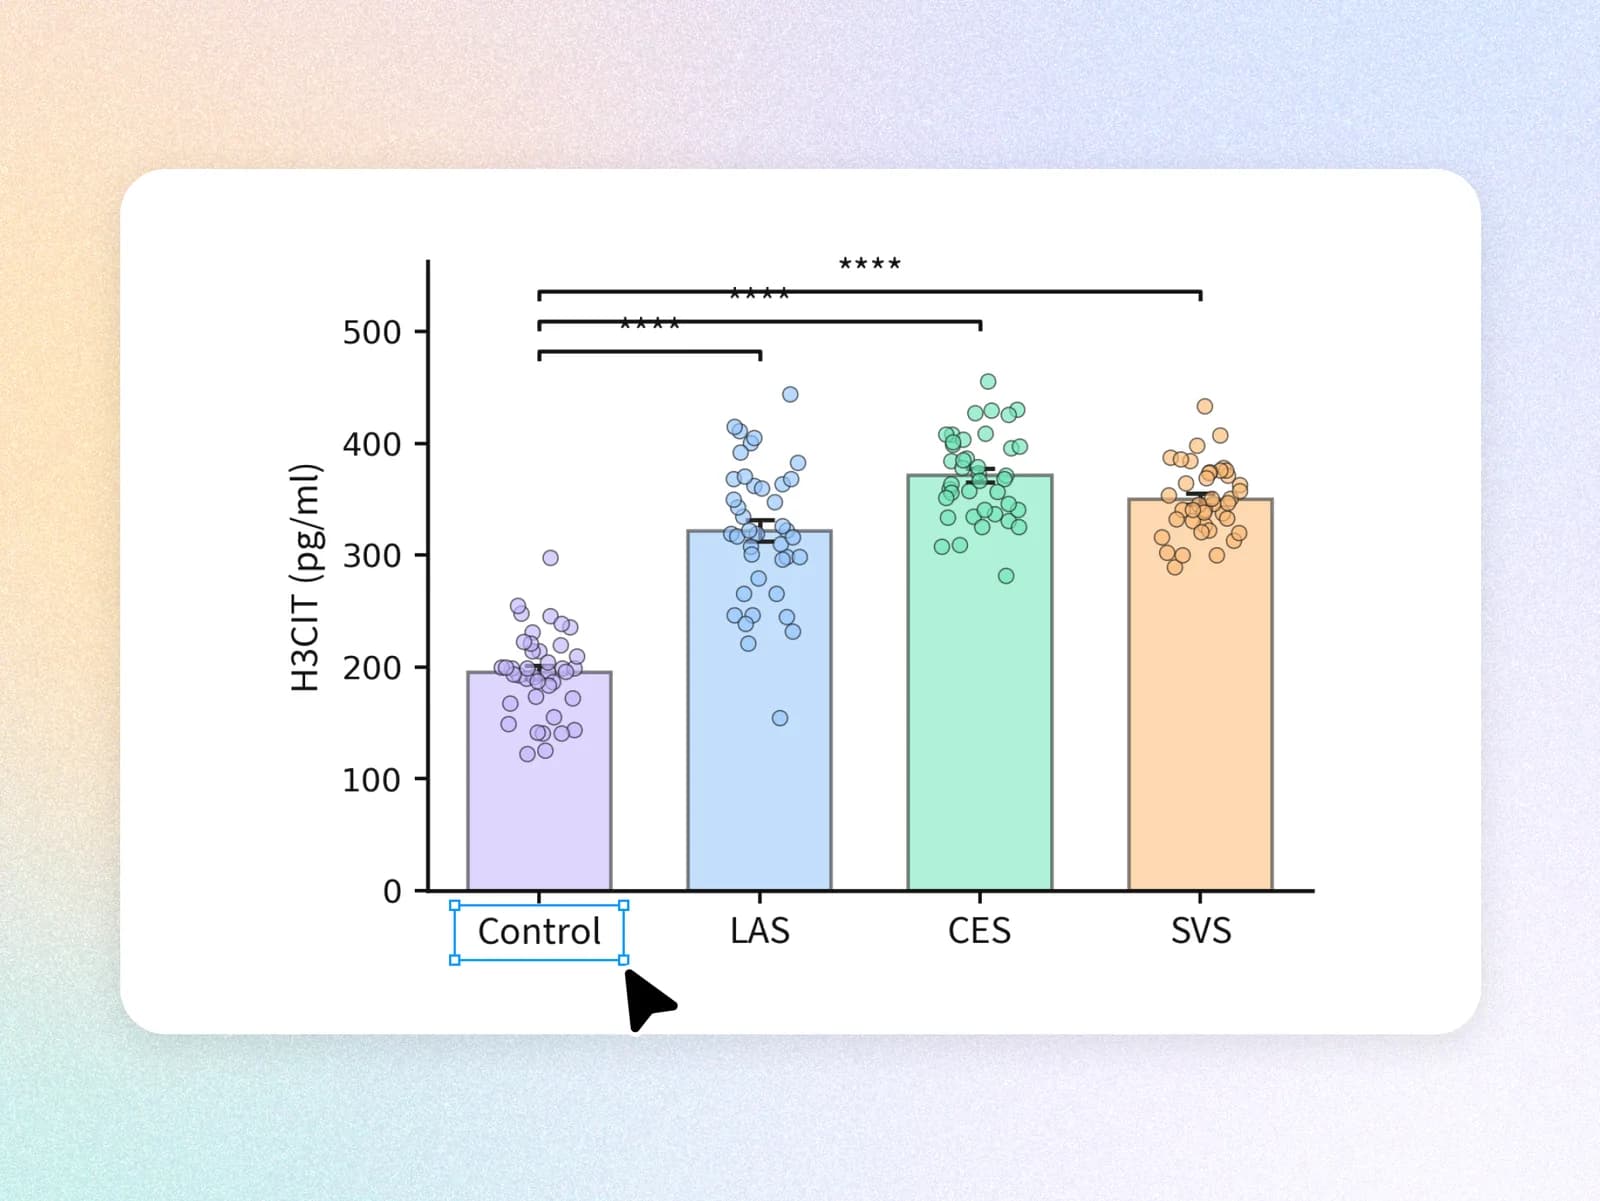
02. Refine
Adjust labels, colors, chart type, and style with chat and AI tools.
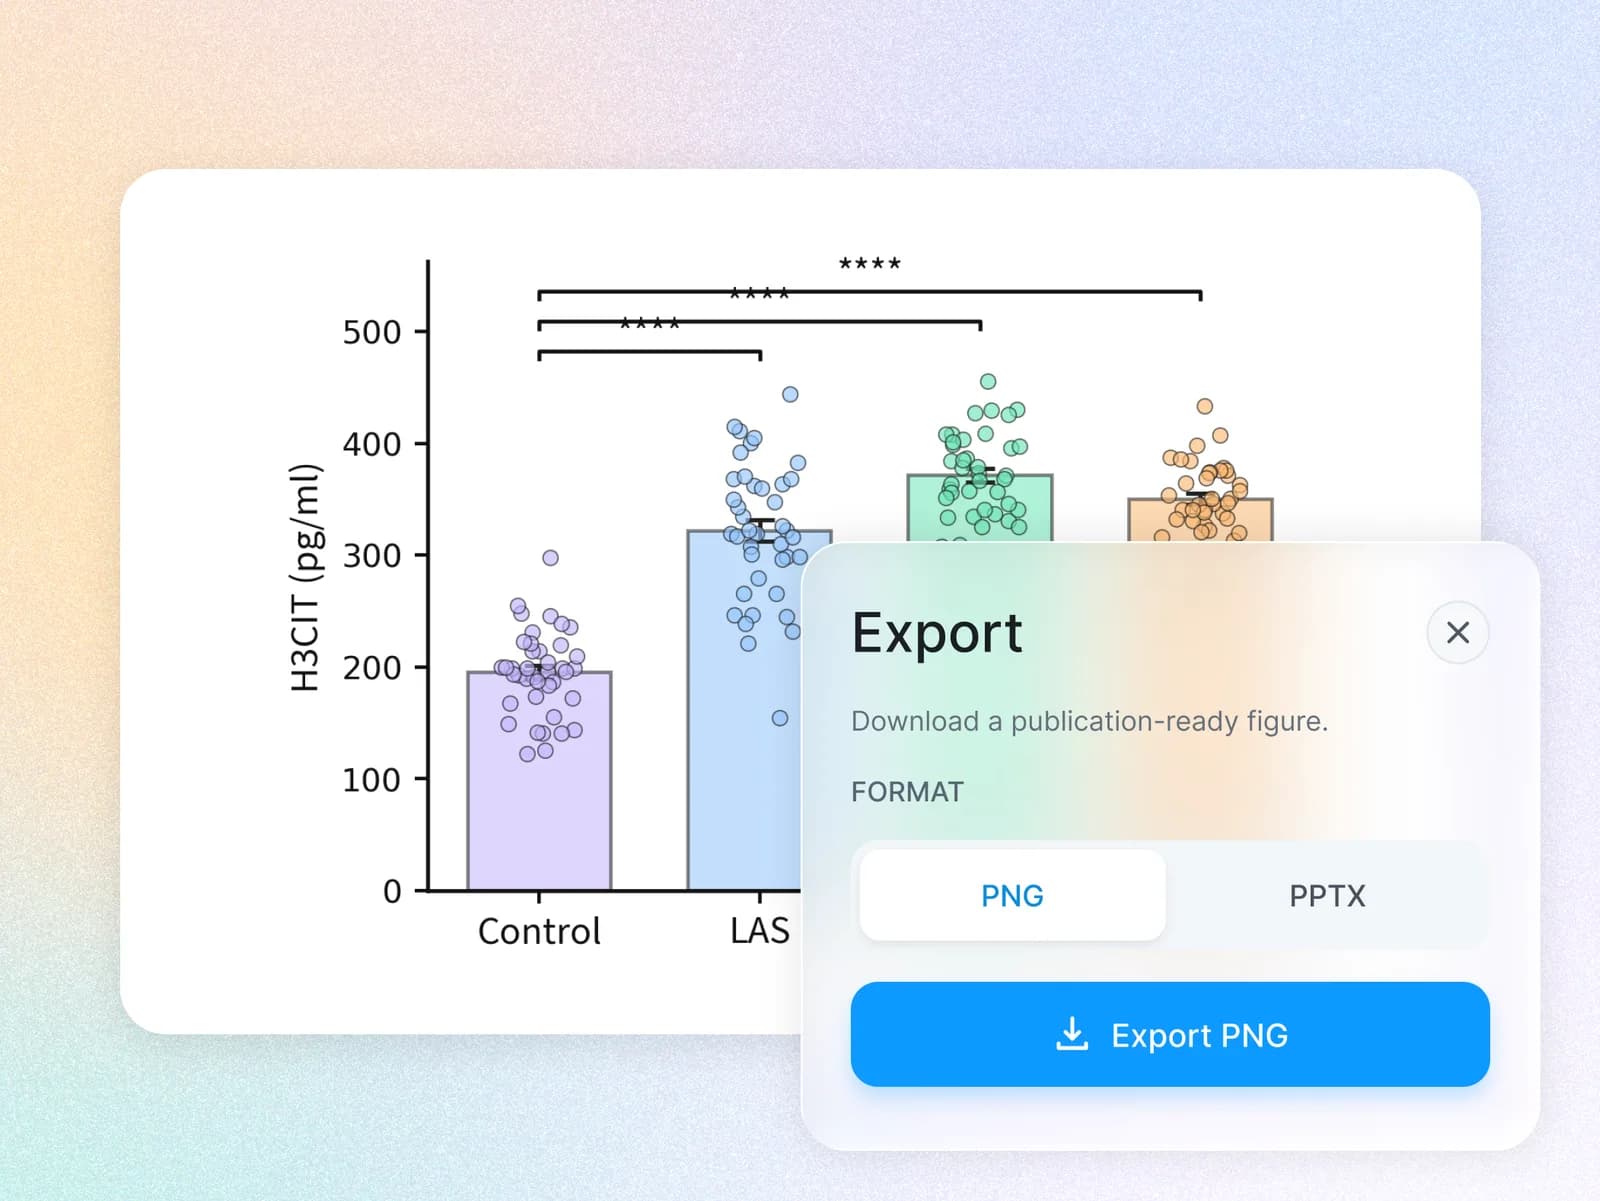
03. Export
Export as PNG, SVG, or PPTX for papers — or download Python code.
Everything you need to create scientific plots
From Data to Journal-Ready Plots
Turn CSV, Excel, or pasted data into polished plots with journal-ready styling built in.
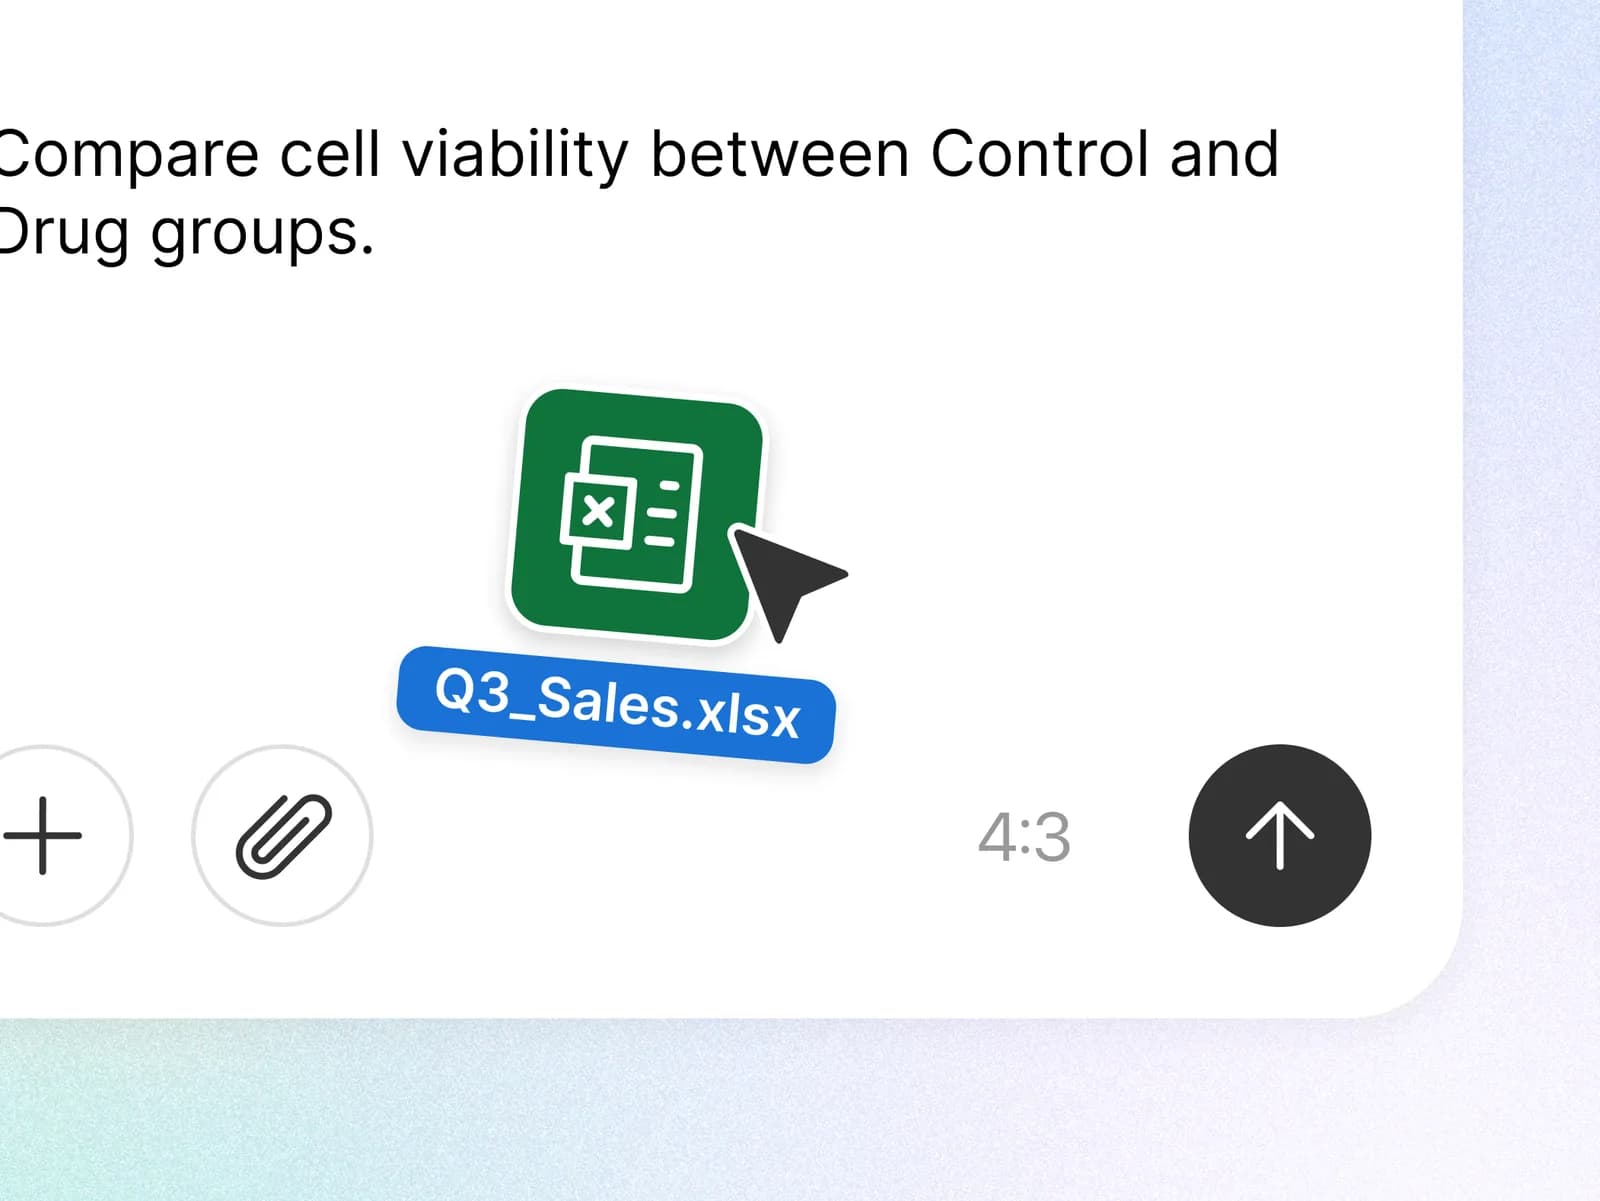
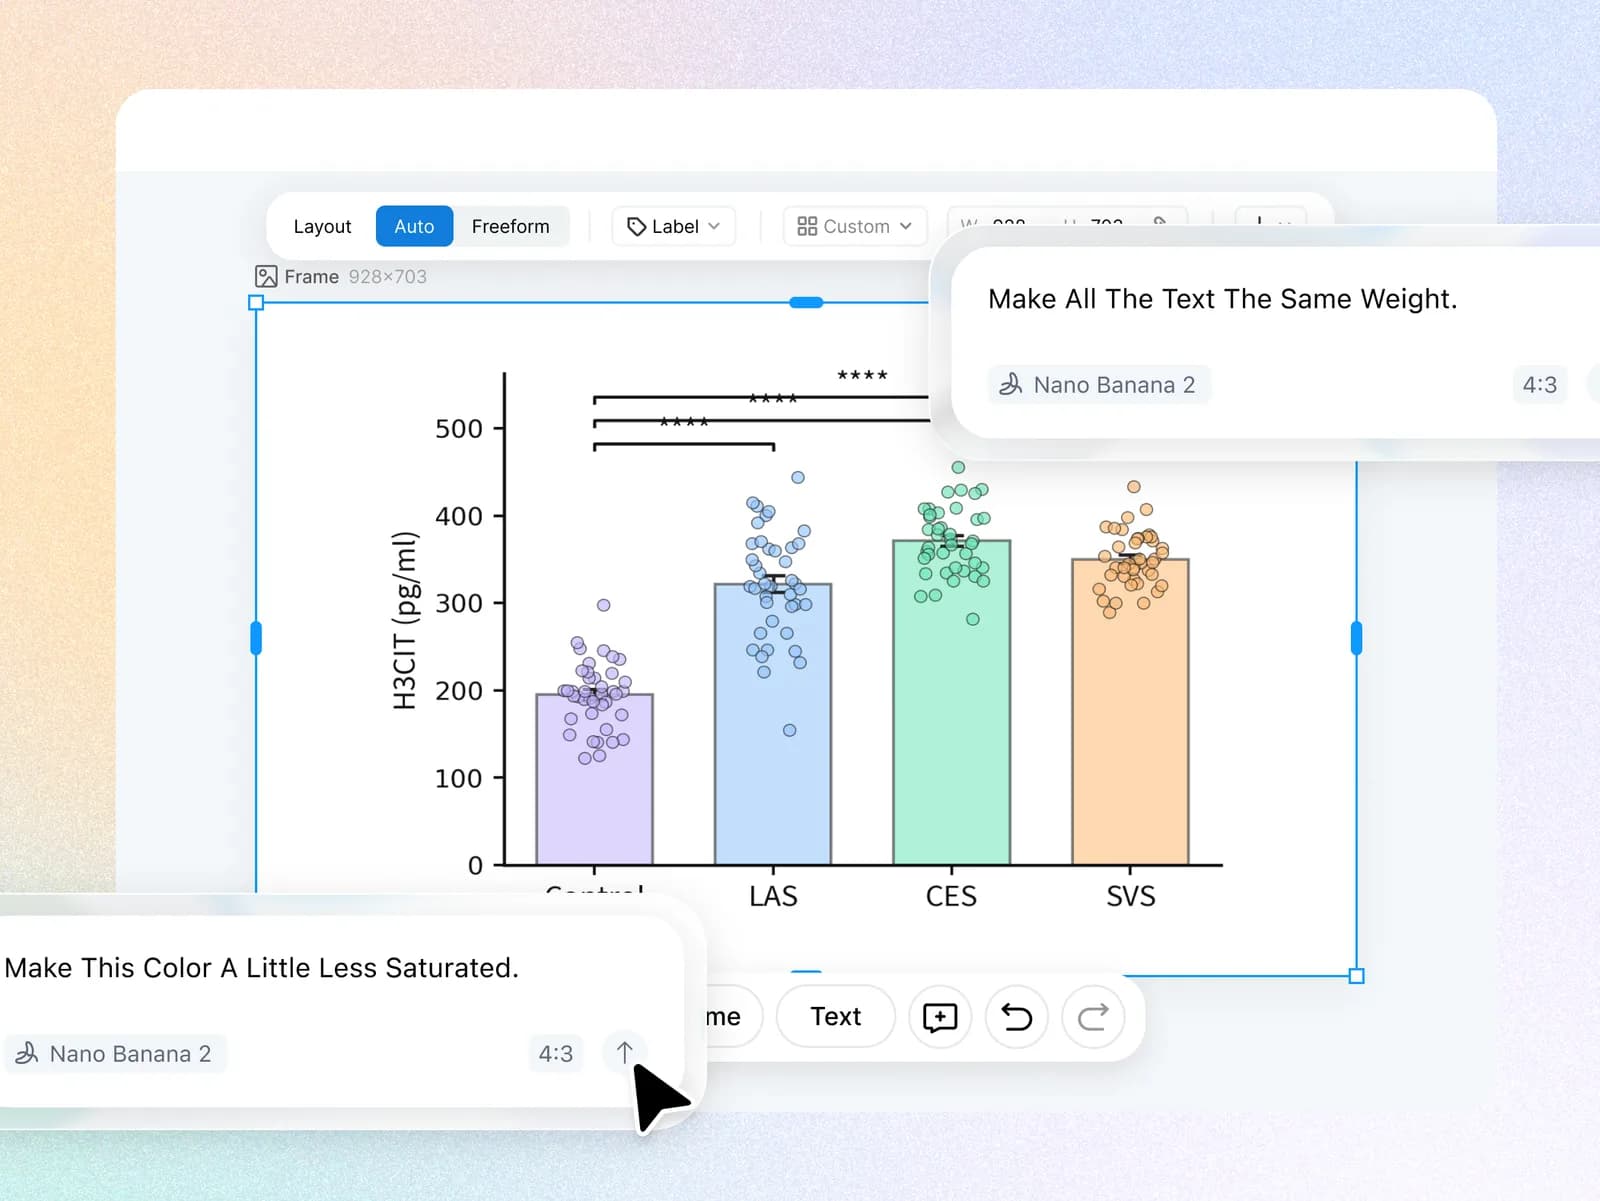
Refine Every Detail with AI
Change labels, axes, colors, annotations, chart types, and layouts through a simple conversation.
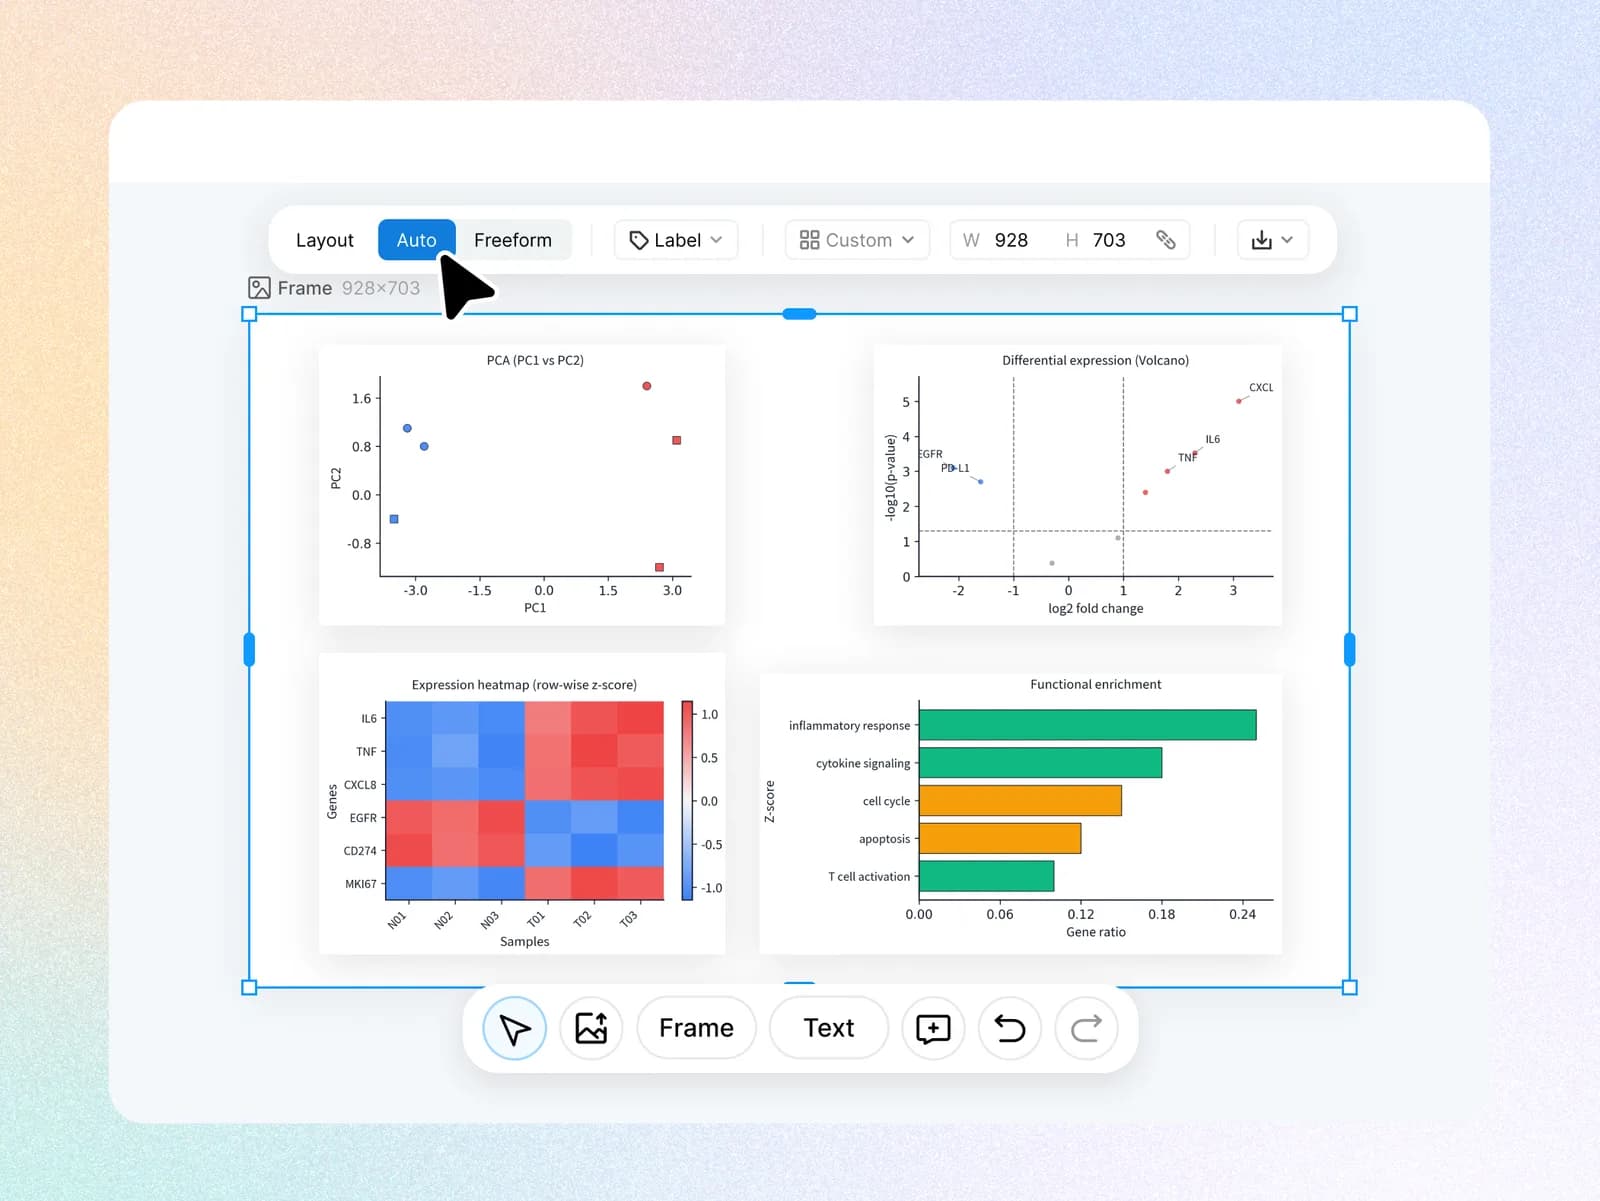
Build Multi-Panel Figures
Arrange and align multiple plots into a multi-panel figure on an infinite canvas.
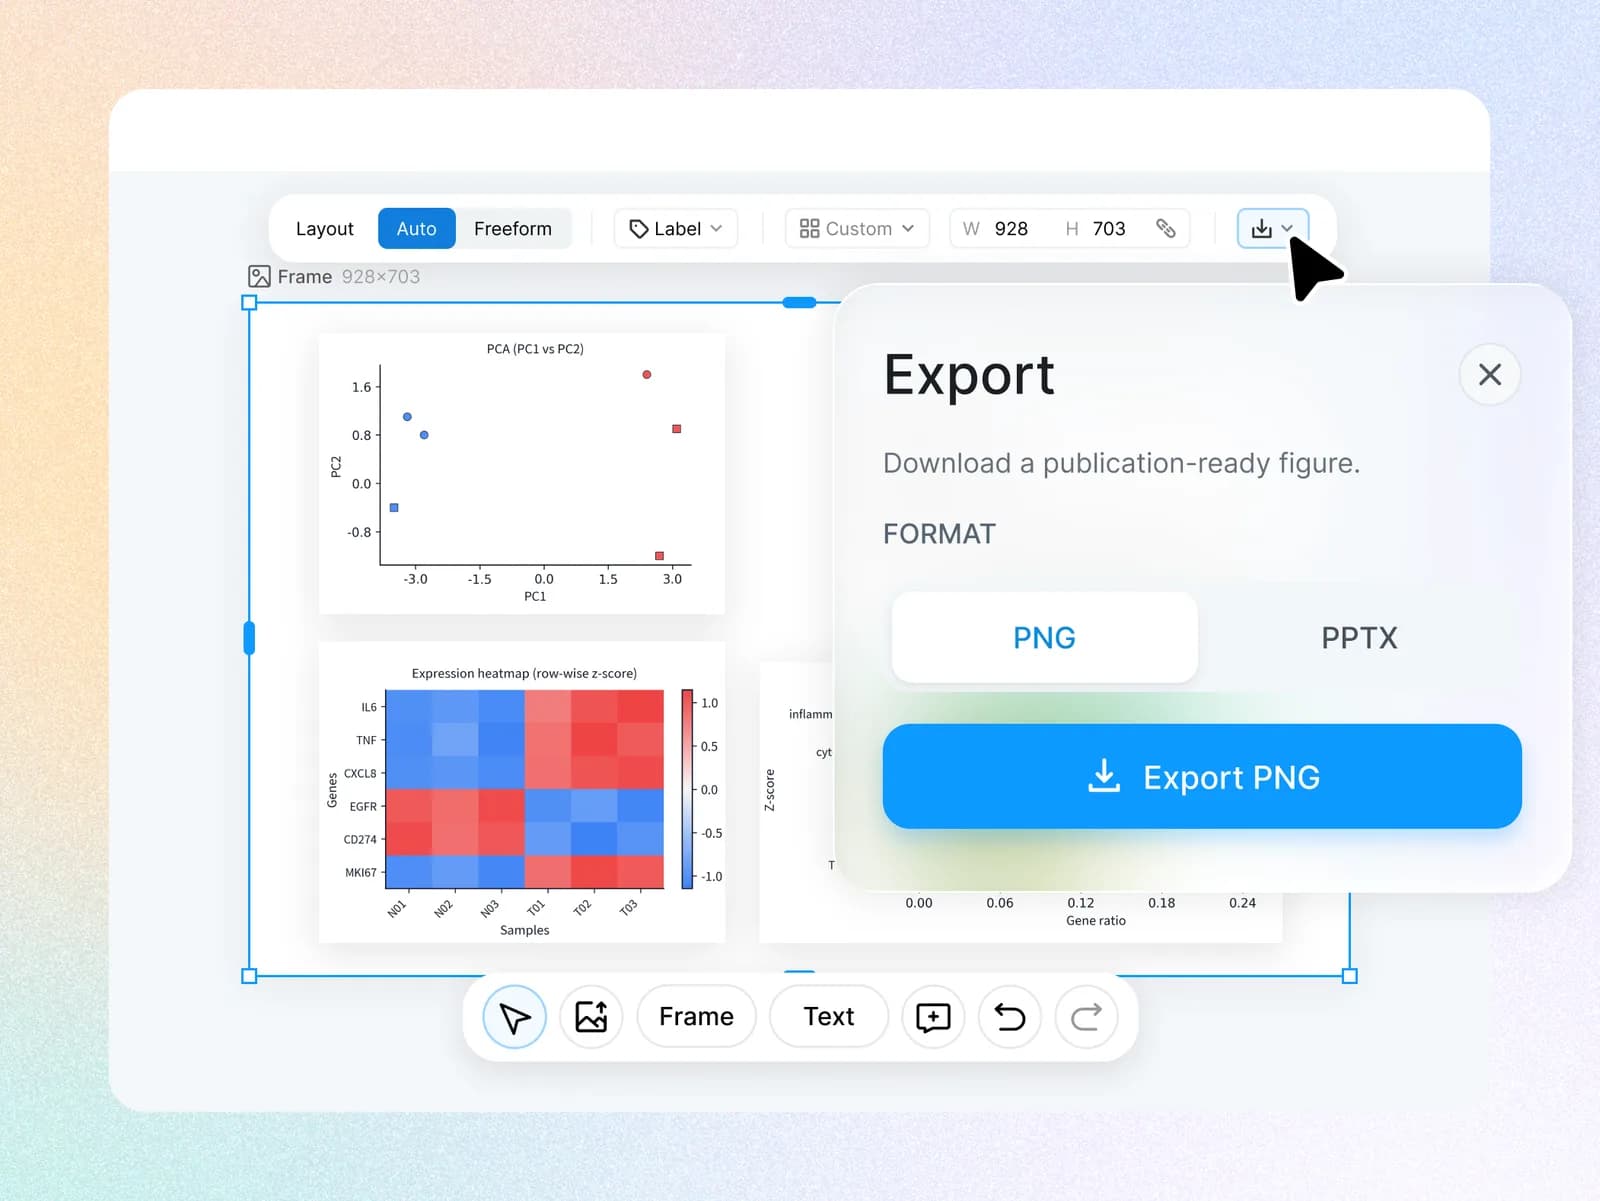
Ready for Publication
Export PNG, JPG, SVG, PPTX, or download the Python code, with a publication certificate available.
Who is it for

Omics & Bioinformatics Researchers
Volcano plots, heatmaps, PCA plots, enrichment plots

Experimental Scientists
Box plots, scatter plots, dose-response curves, time-course plots

Clinical Researchers
Kaplan-Meier curves, forest plots, ROC curves, waterfall plots