AI 科研数据图生成器

立即将统计结果转化为期刊级数据可视化。

将原始数据转化为可发表级数据图

1 of 10

3 步创建科研数据图
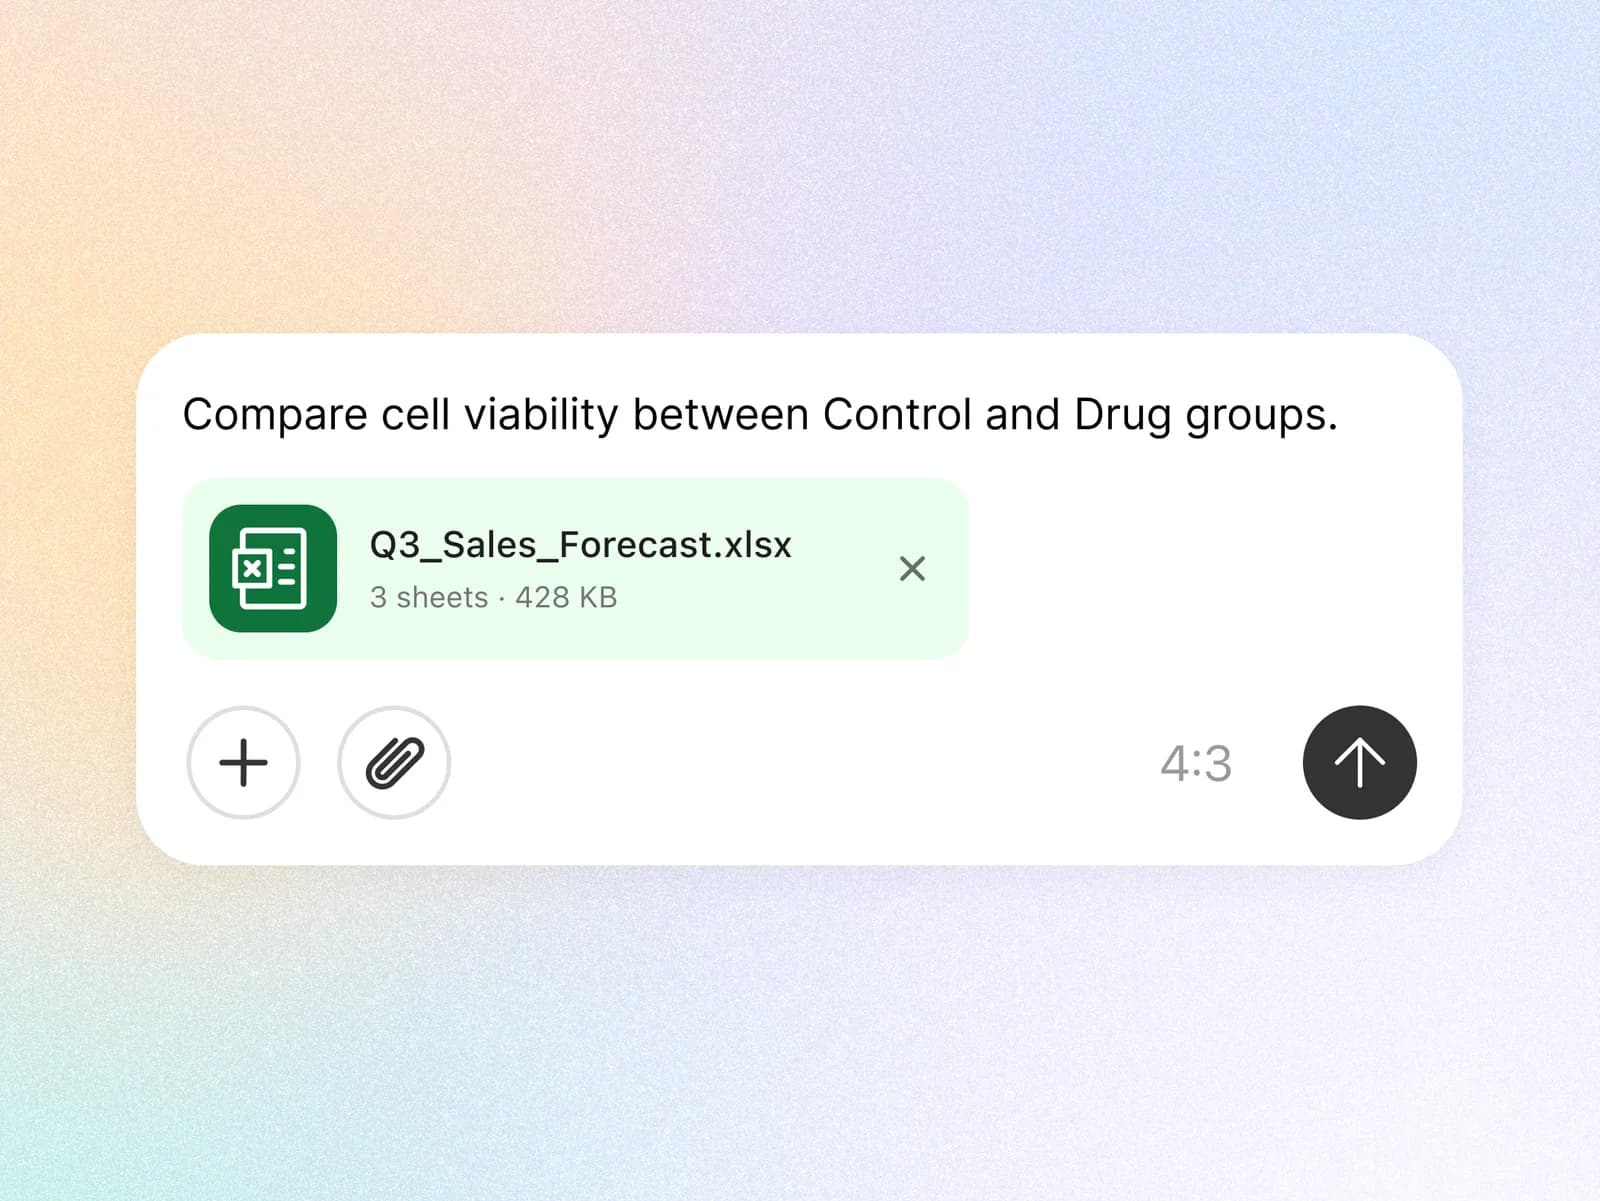
  1. Prompt comparing cell viability with an attached Excel spreadsheet

    01. 生成

    上传 Excel 文件或直接粘贴数据,即可获得 Nature 风格数据图。
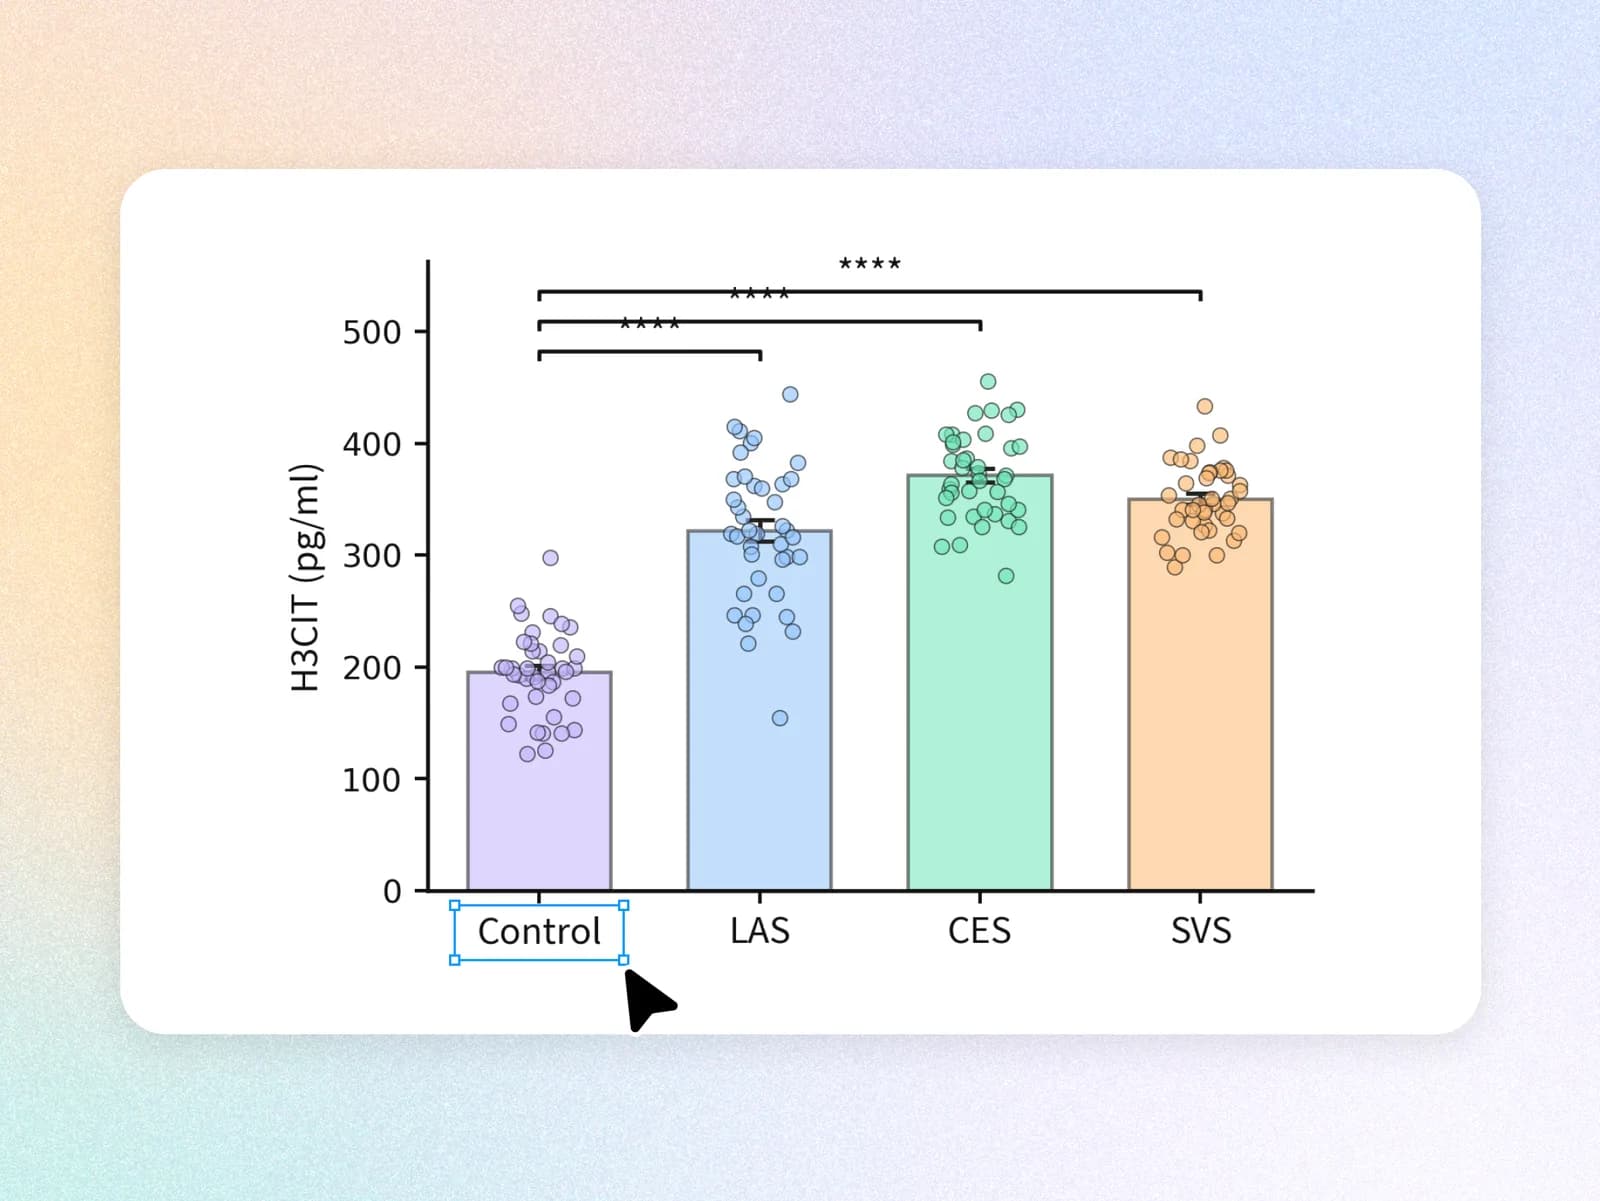
  2. Bar plot of H3CIT levels with the Control axis label selected for editing

    02. 调整

    通过对话和 AI 工具调整标签、颜色、图表类型和风格。

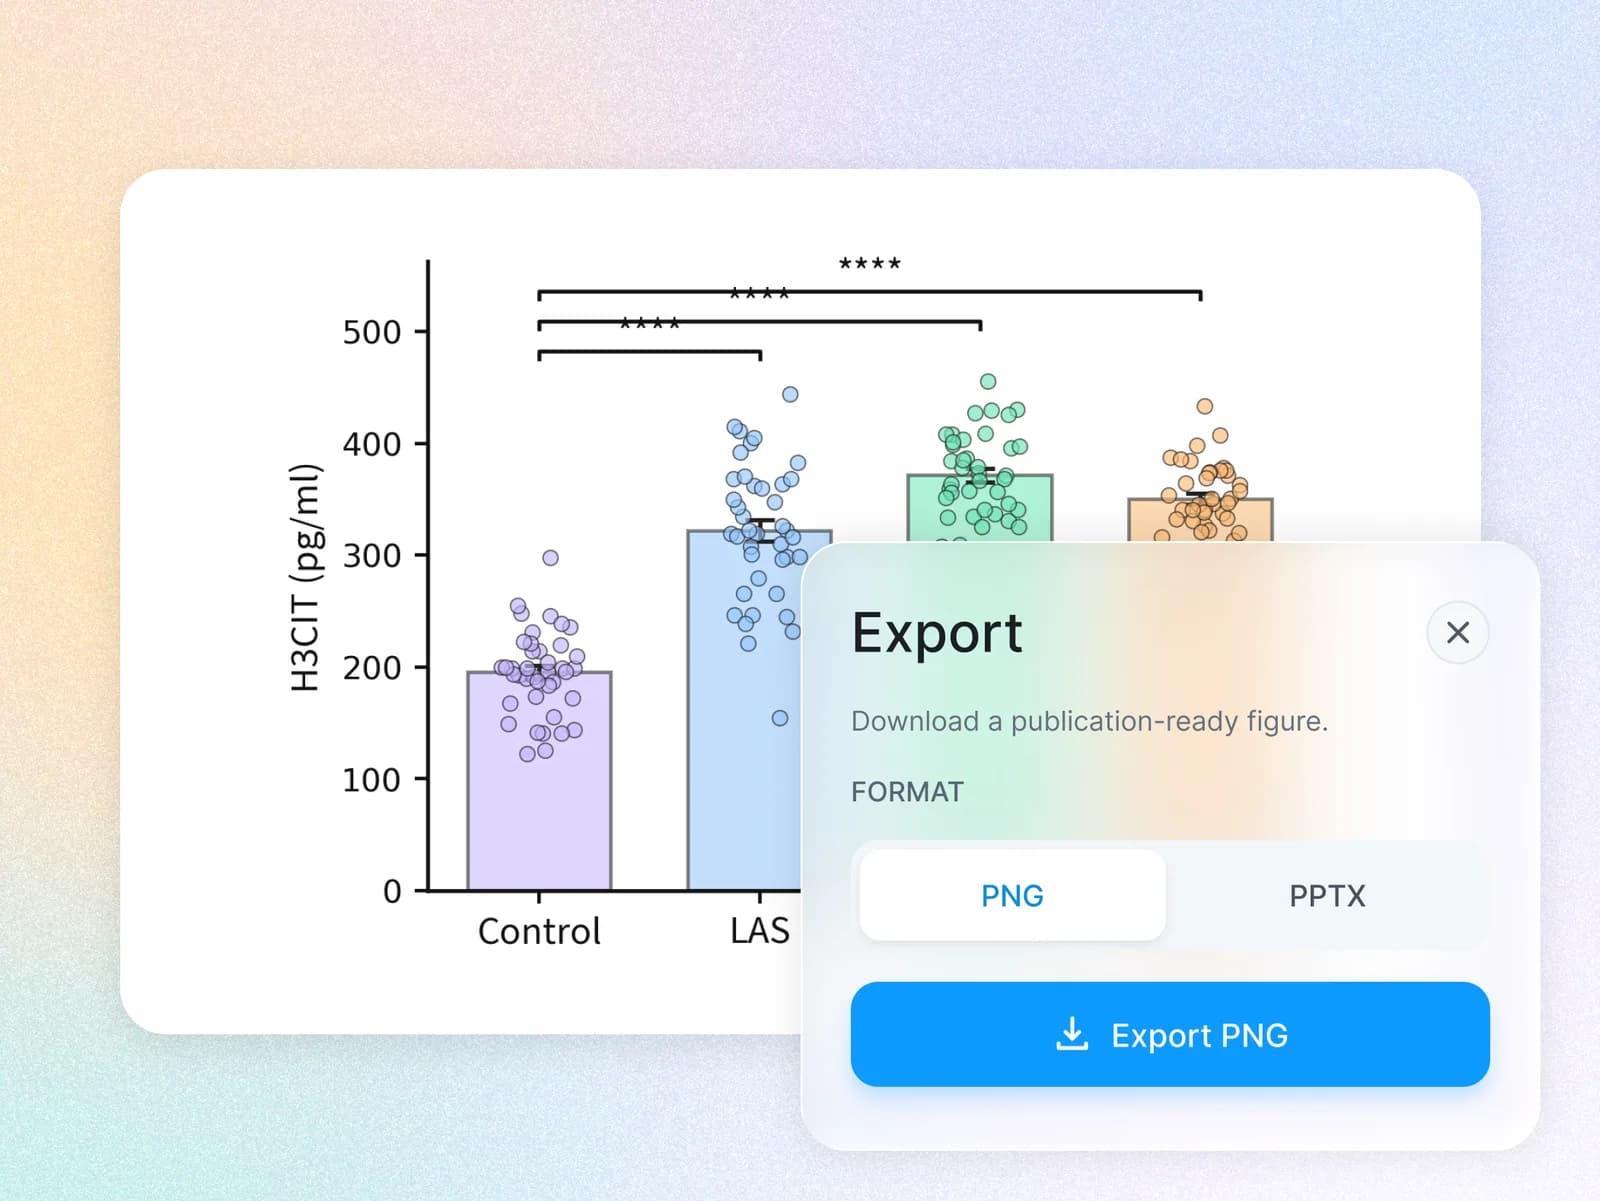
  3. Export dialog over a scientific bar plot, with PNG selected

    03. 导出

    导出为 PNG、SVG 或 PPTX 用于论文,也可下载 Python 代码。

创建科研数据图所需的一切

  1. 从数据到期刊级数据图

    将 CSV、Excel 或粘贴的数据转换为内置期刊风格的精美数据图。
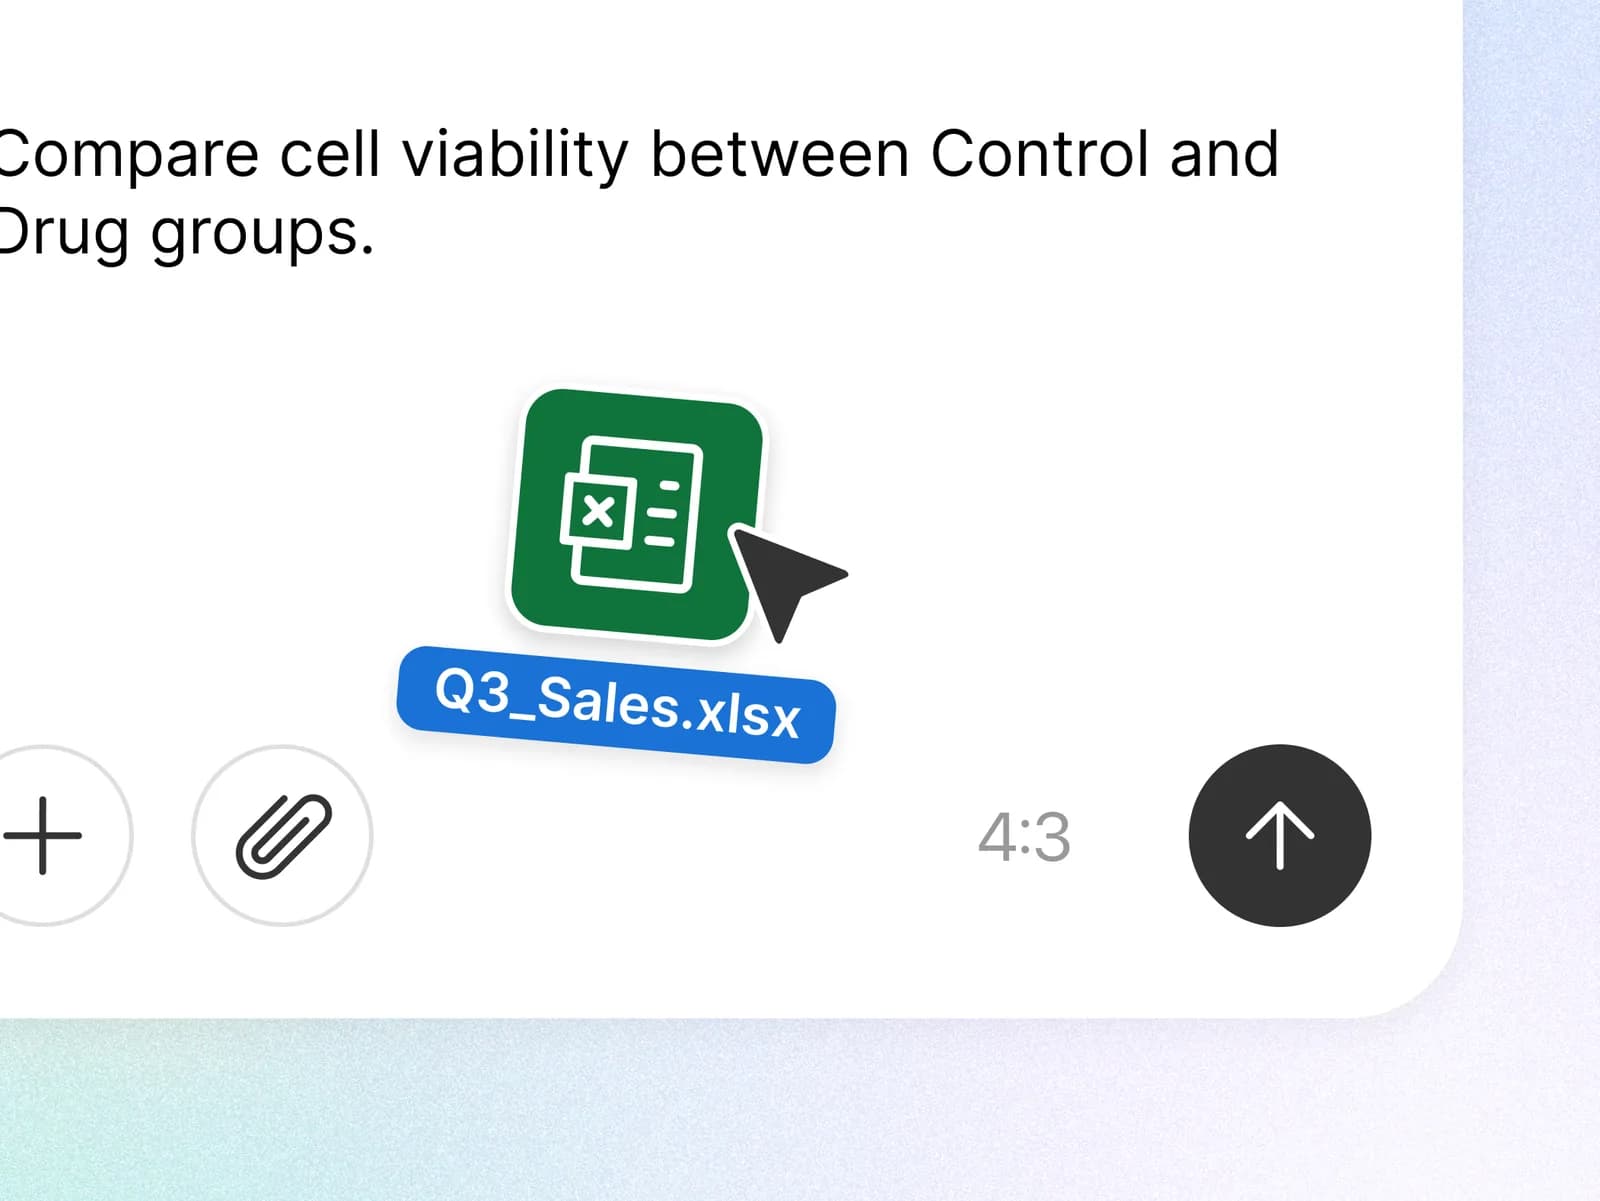
    Prompt comparing cell viability, with an Excel spreadsheet attached
  2. 使用 AI 精调每个细节

    通过简单对话修改标签、坐标轴、颜色、标注、图表类型和布局。
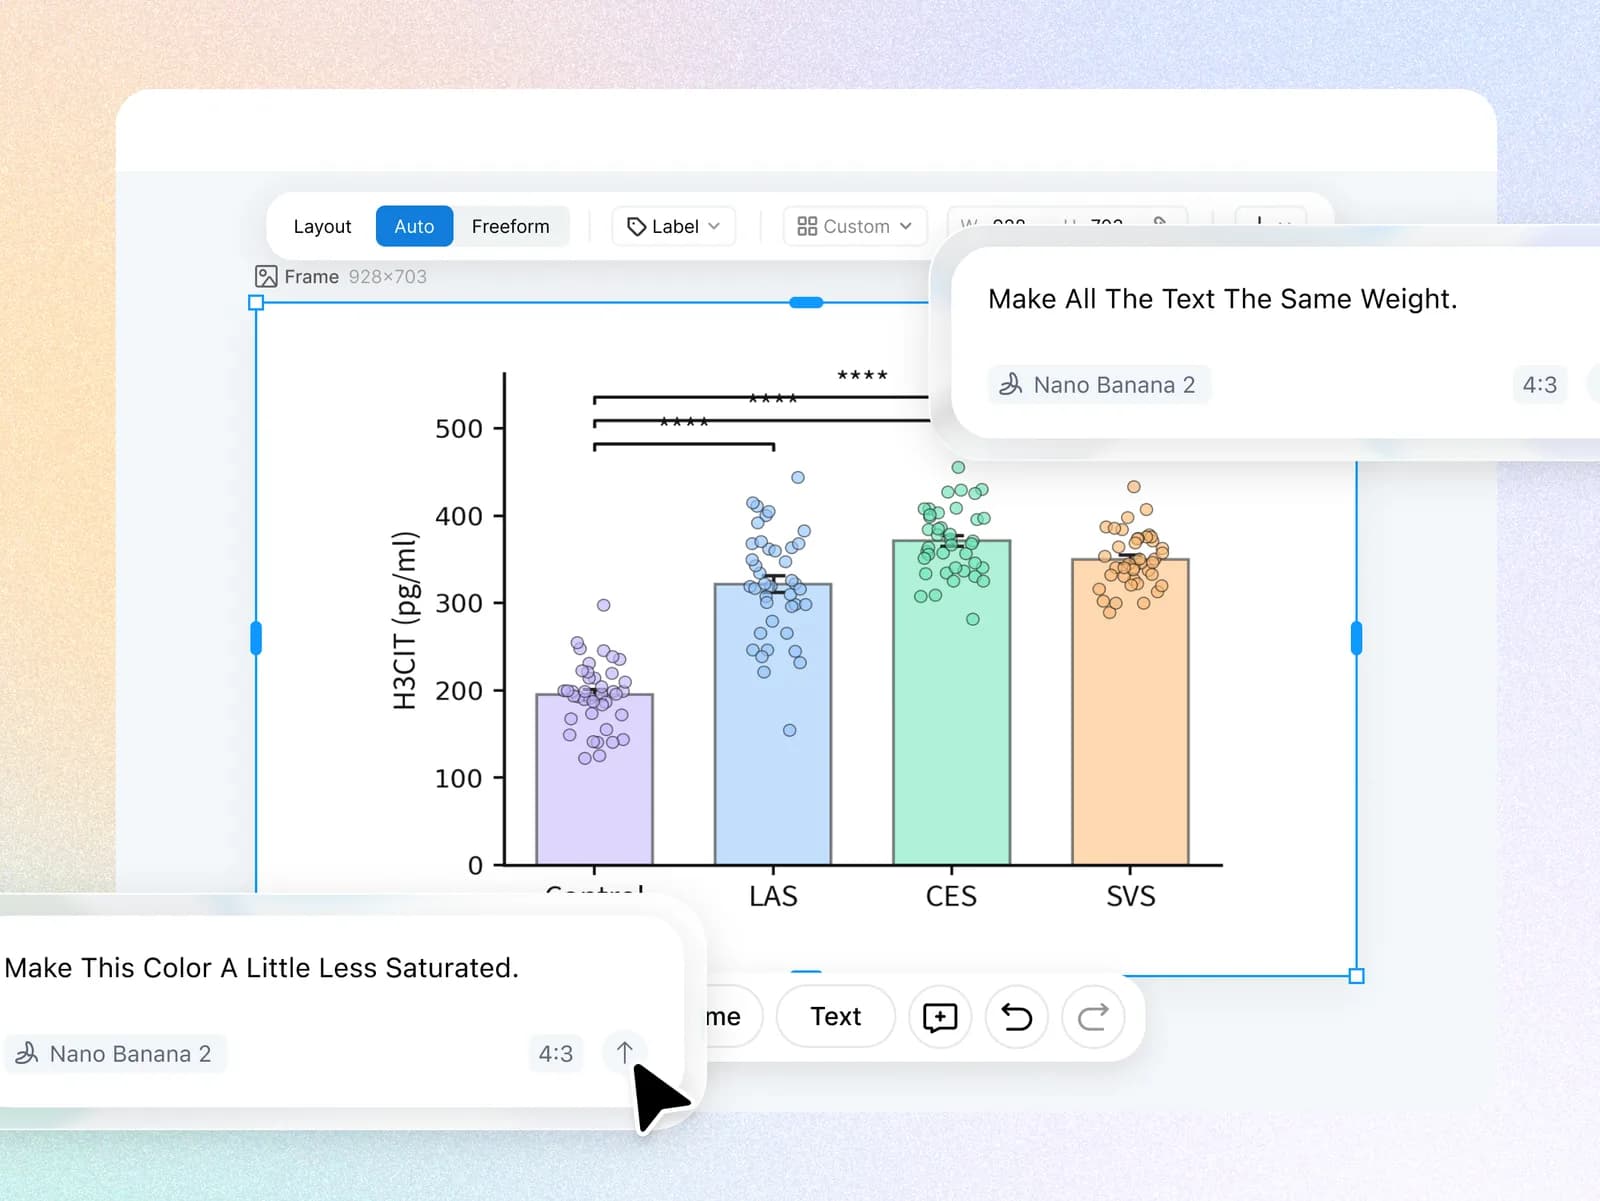
    H3CIT bar plot with chat prompts to match text weight and desaturate a color
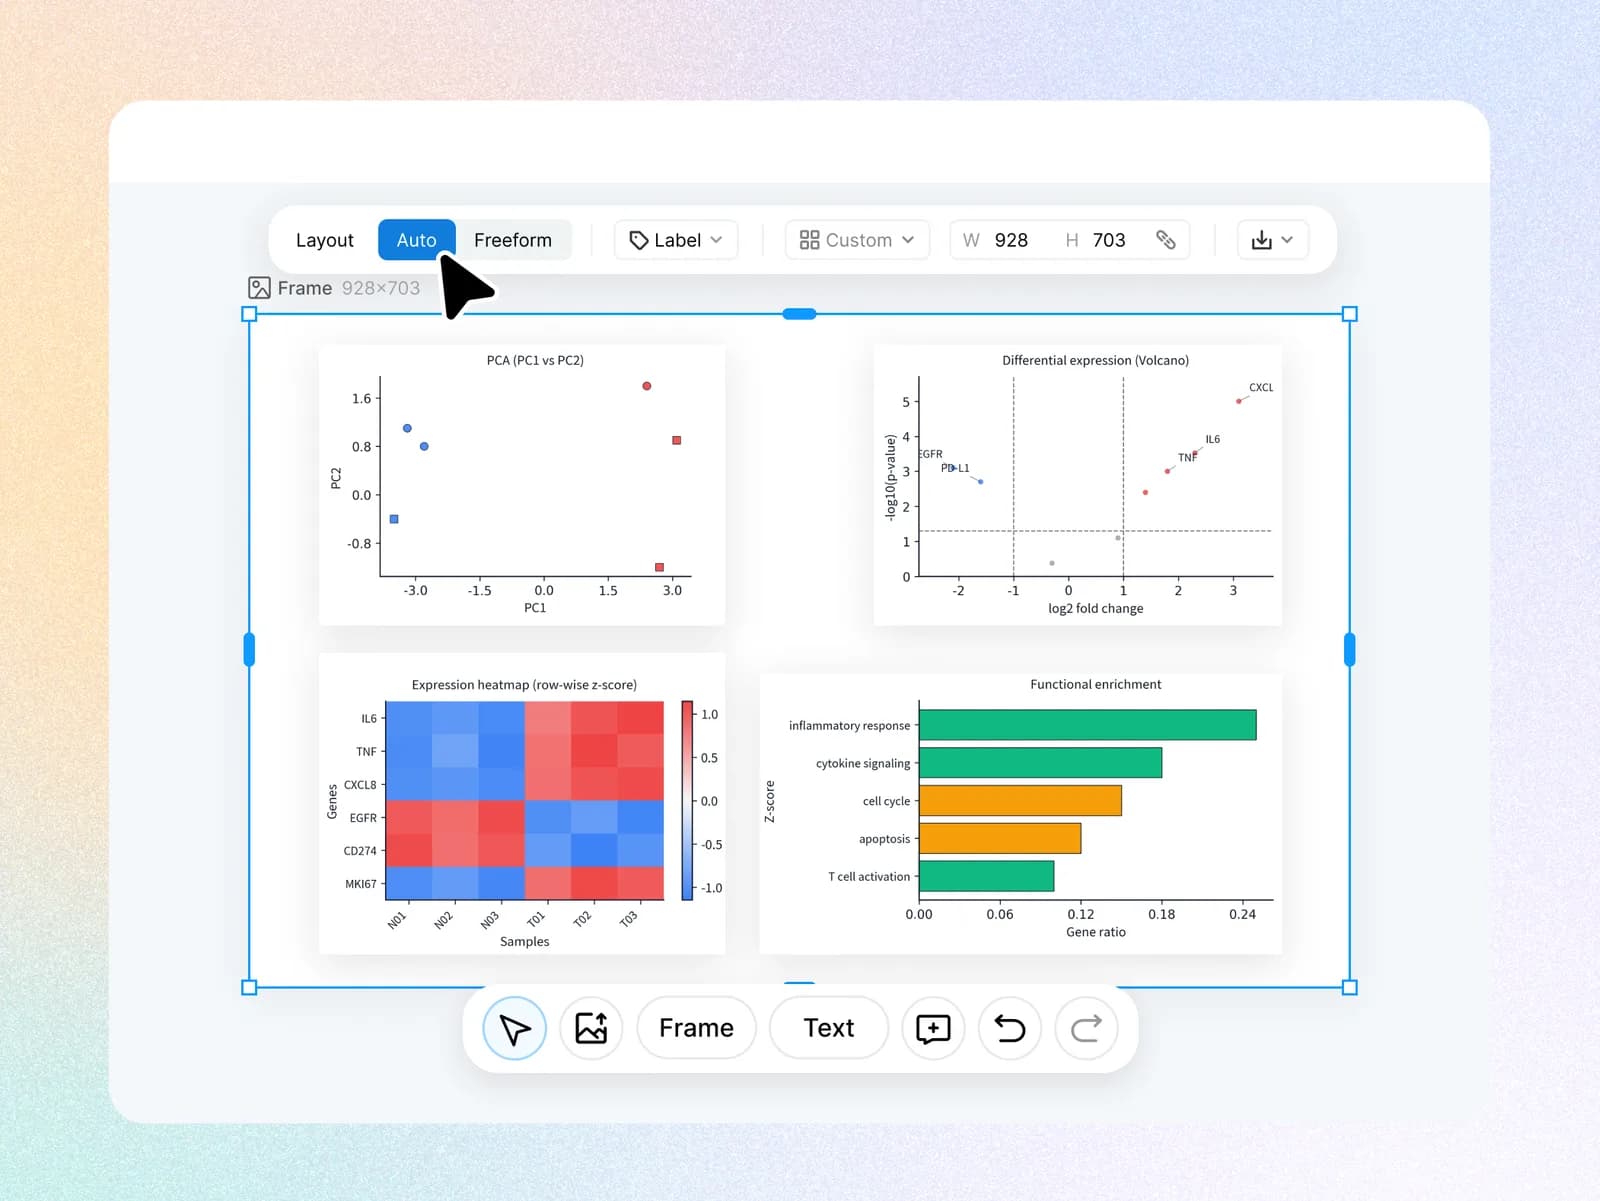
  3. 构建多面板科研图

    在无限画布上排列和对齐多个数据图,组成多面板科研图。

    Four-panel figure with a PCA plot, volcano plot, expression heatmap, and enrichment chart
  4. 可直接用于发表

    导出 PNG、JPG、SVG、PPTX 或下载 Python 代码,并可获取发表授权证书。
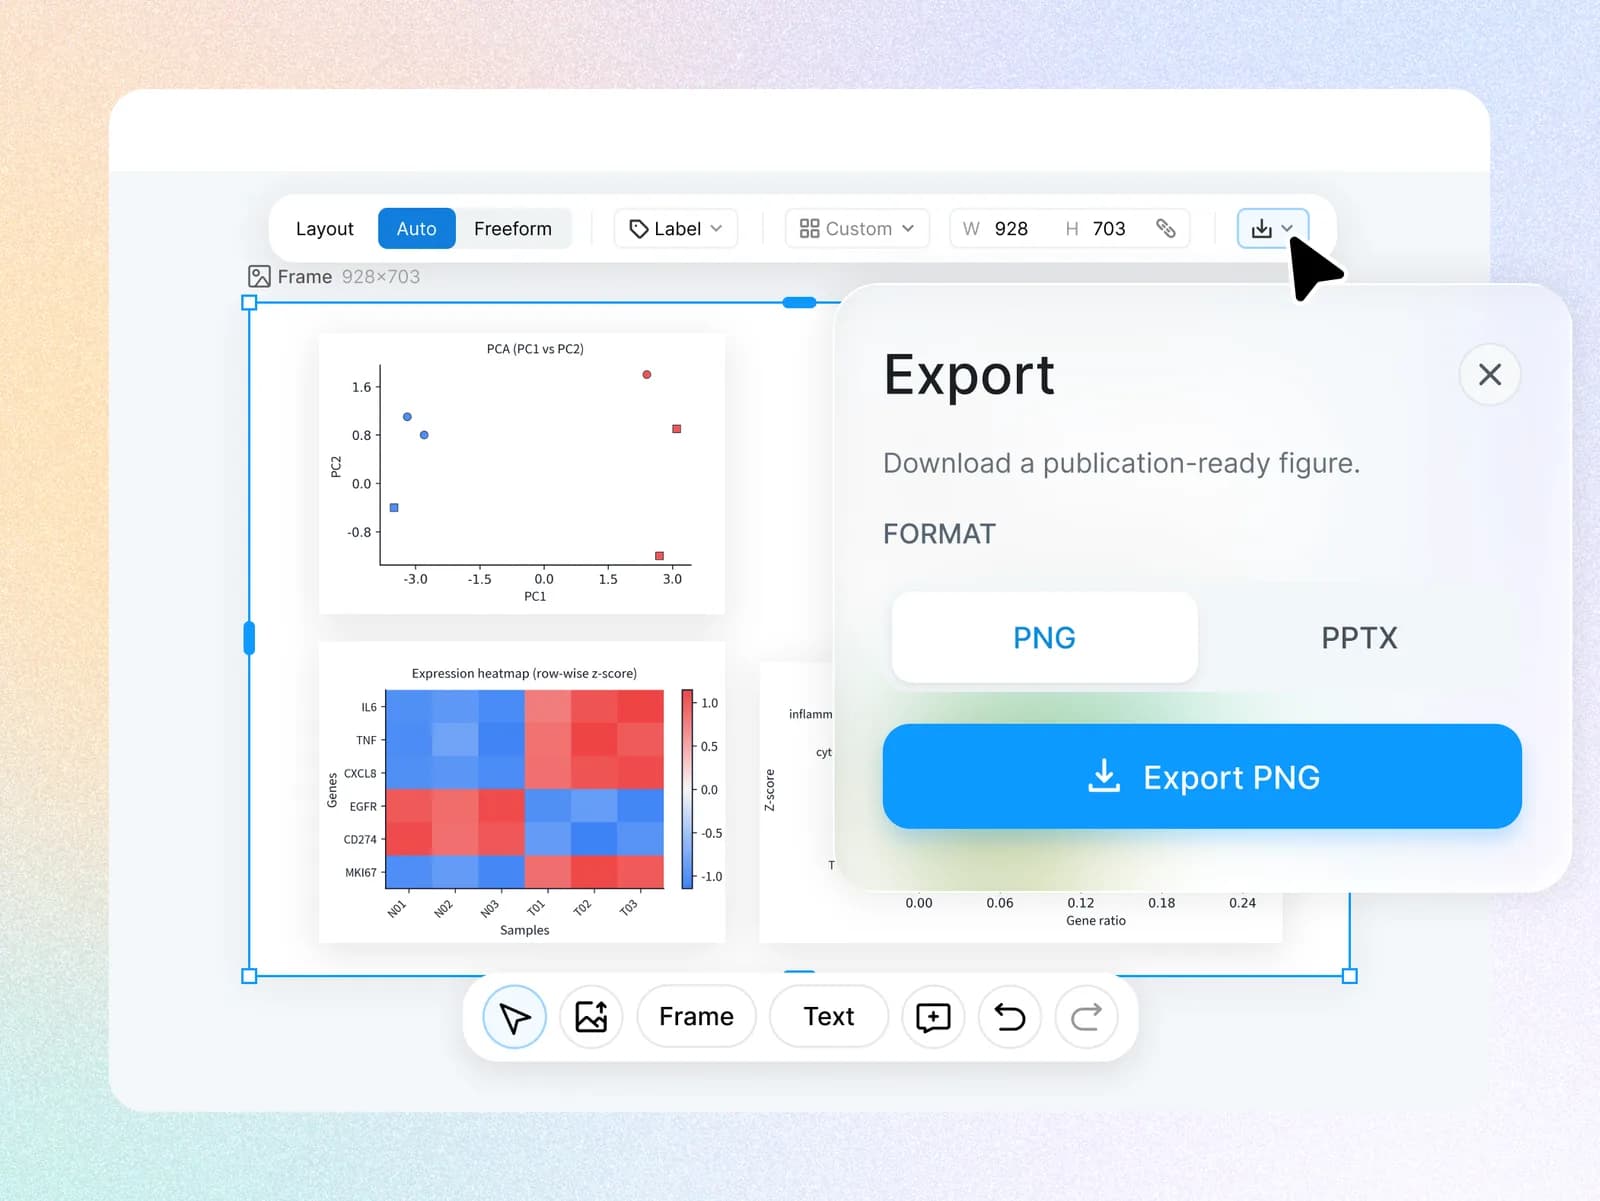
    Export dialog over a multi-panel omics figure, with PNG selected

适用人群

  • Fifi mascot as an engineer with a tablet and robotic arm

    组学与生物信息学研究人员

    火山图、热图、PCA 图、富集分析图

  • Fifi mascot as a lab scientist holding a test tube

    实验科学家

    箱线图、散点图、剂量反应曲线、时间序列图

  • Fifi mascot as a doctor with a stethoscope

    临床研究人员

    Kaplan-Meier 曲线、森林图、ROC 曲线、瀑布图

探索更多 AI 科研图生成器