AI 科學資料圖生成器

立即將統計結果轉化為期刊級資料視覺化。

將原始資料轉化為可供發表的資料圖

1 of 10

3 步建立科學資料圖
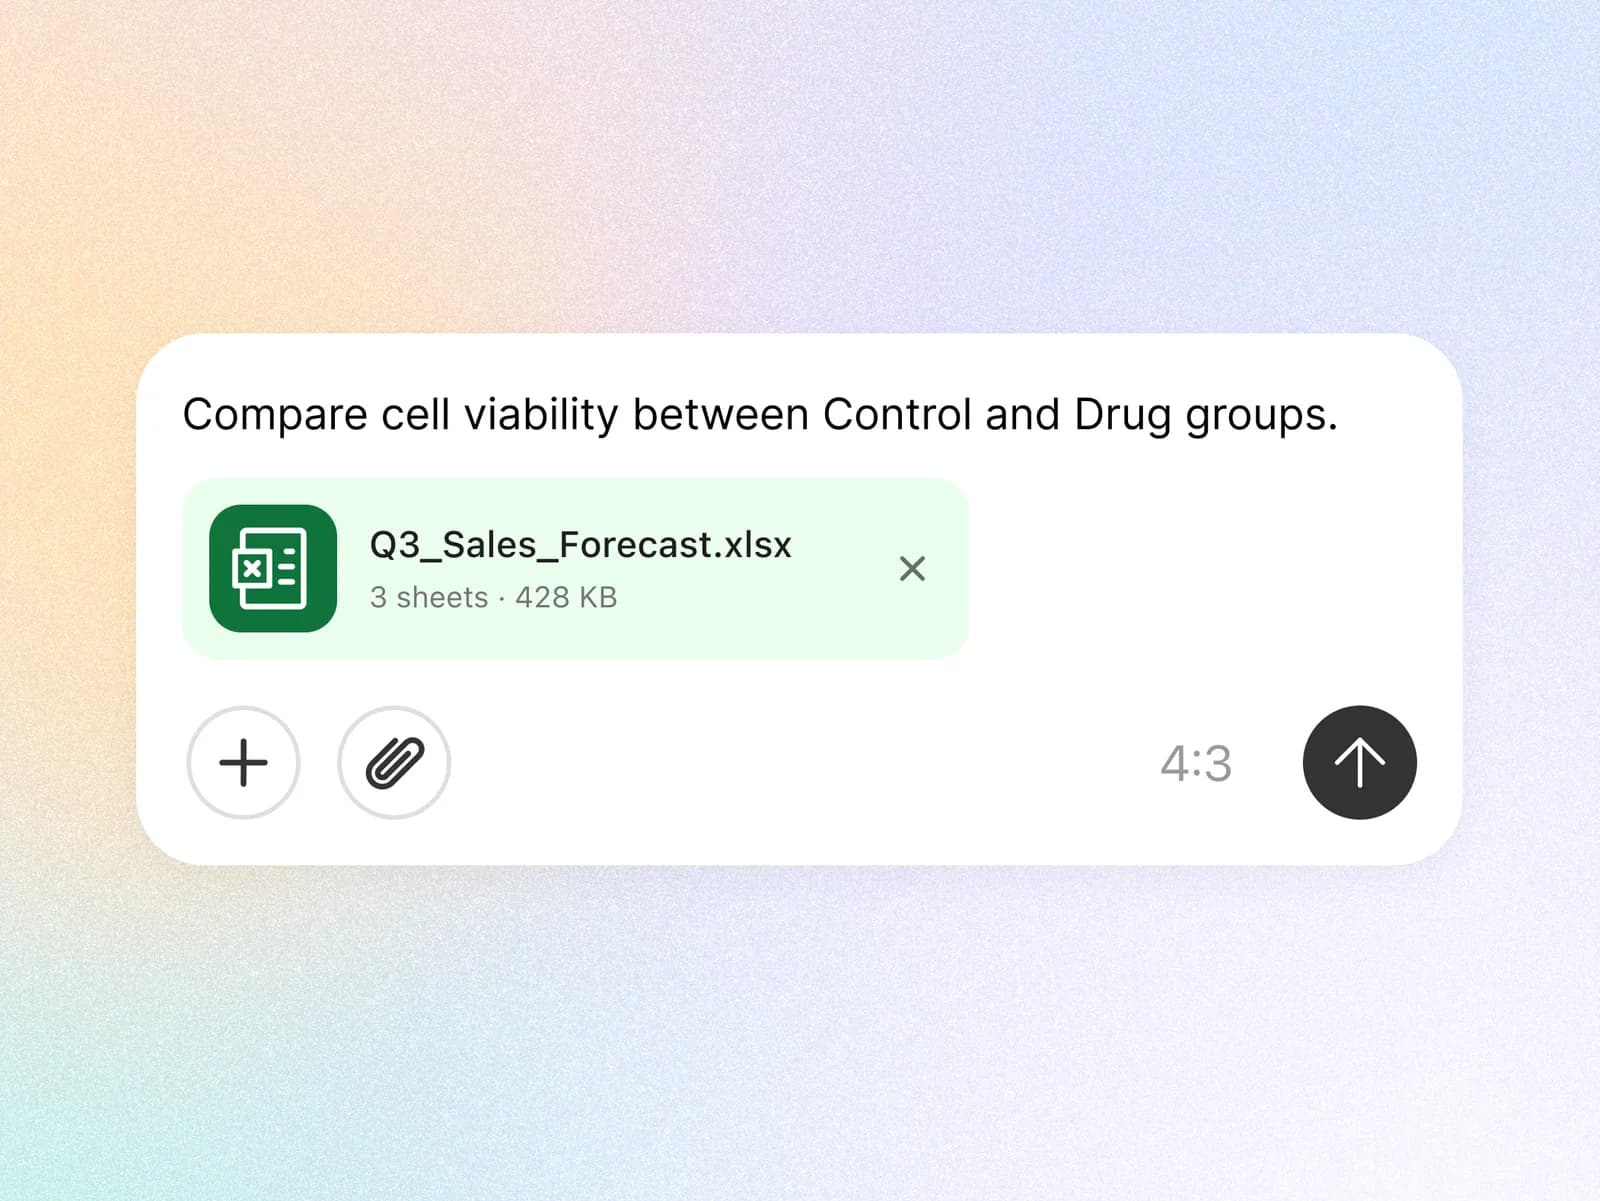
  1. Prompt comparing cell viability with an attached Excel spreadsheet

    01. 生成

    上傳 Excel 檔案或直接貼上資料,即可獲得 Nature 風格資料圖。
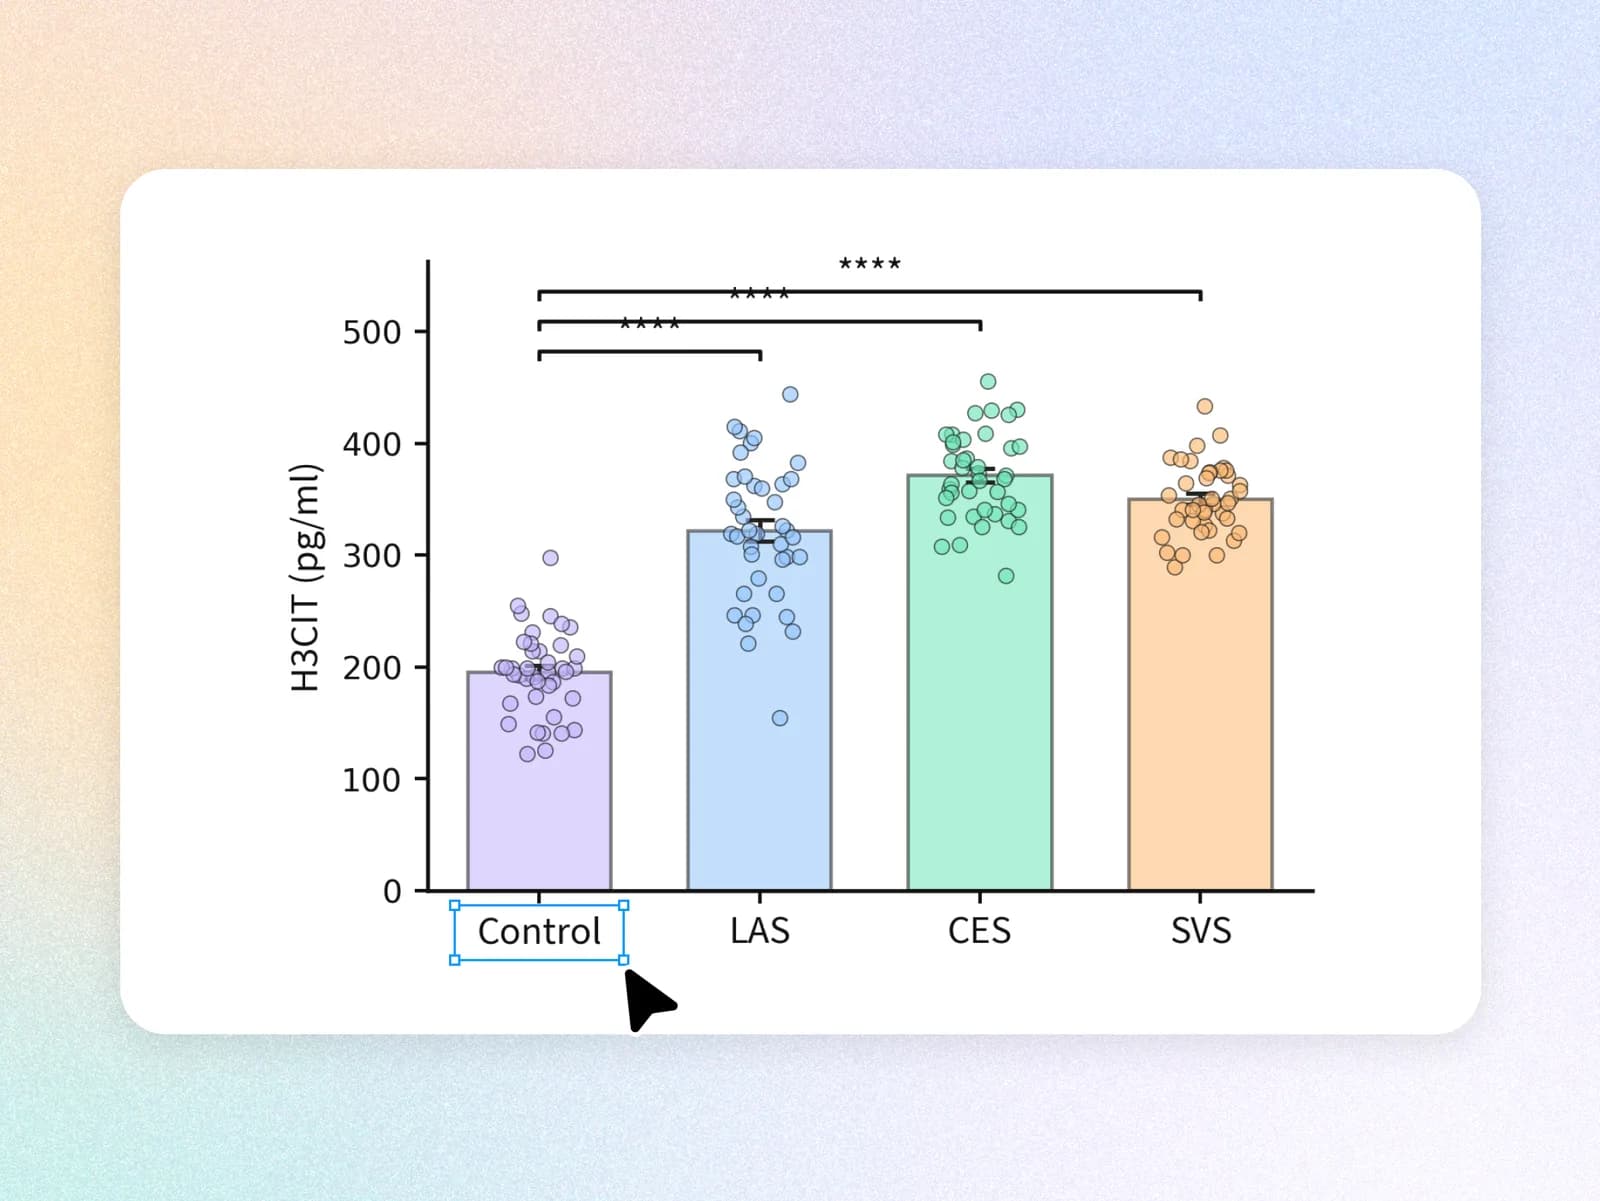
  2. Bar plot of H3CIT levels with the Control axis label selected for editing

    02. 調整

    透過對話和 AI 工具調整標籤、顏色、圖表類型和風格。

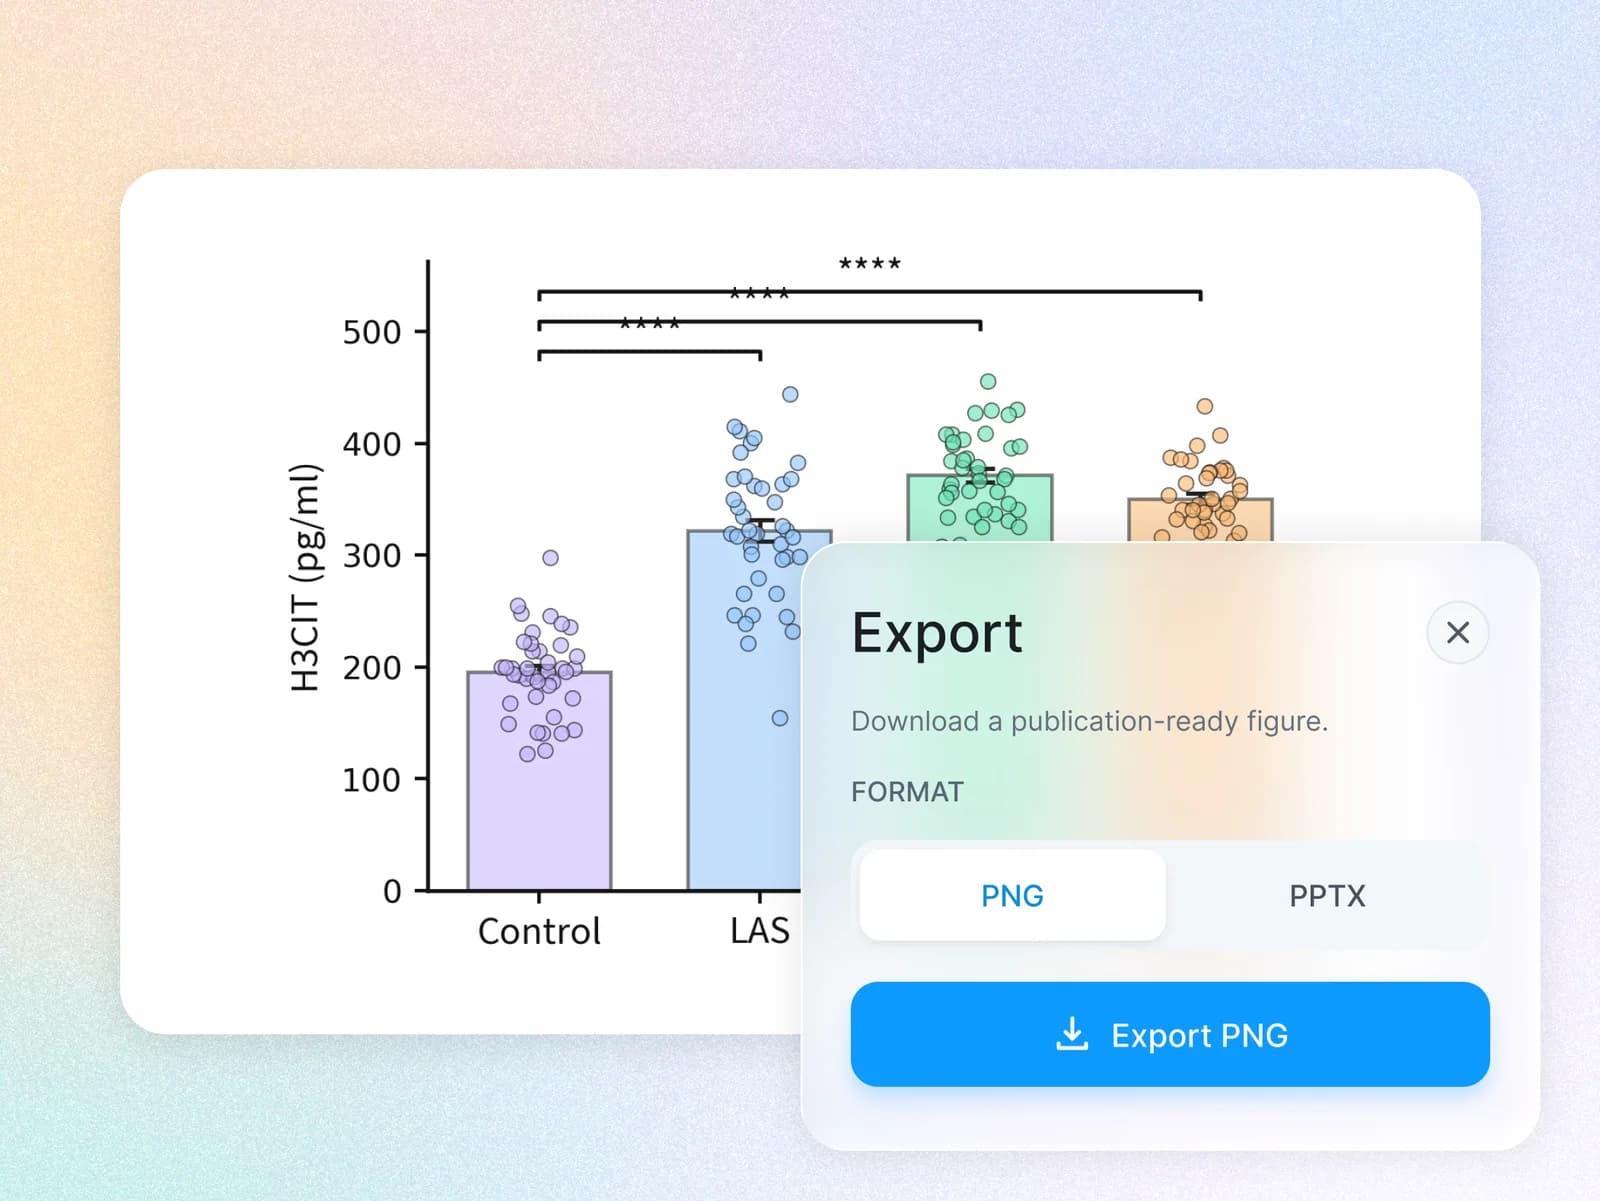
  3. Export dialog over a scientific bar plot, with PNG selected

    03. 匯出

    匯出為 PNG、SVG 或 PPTX 用於論文,也可下載 Python 程式碼。

建立科學資料圖所需的一切

  1. 從資料到期刊級資料圖

    將 CSV、Excel 或貼上的資料轉換為內建期刊風格的精美資料圖。
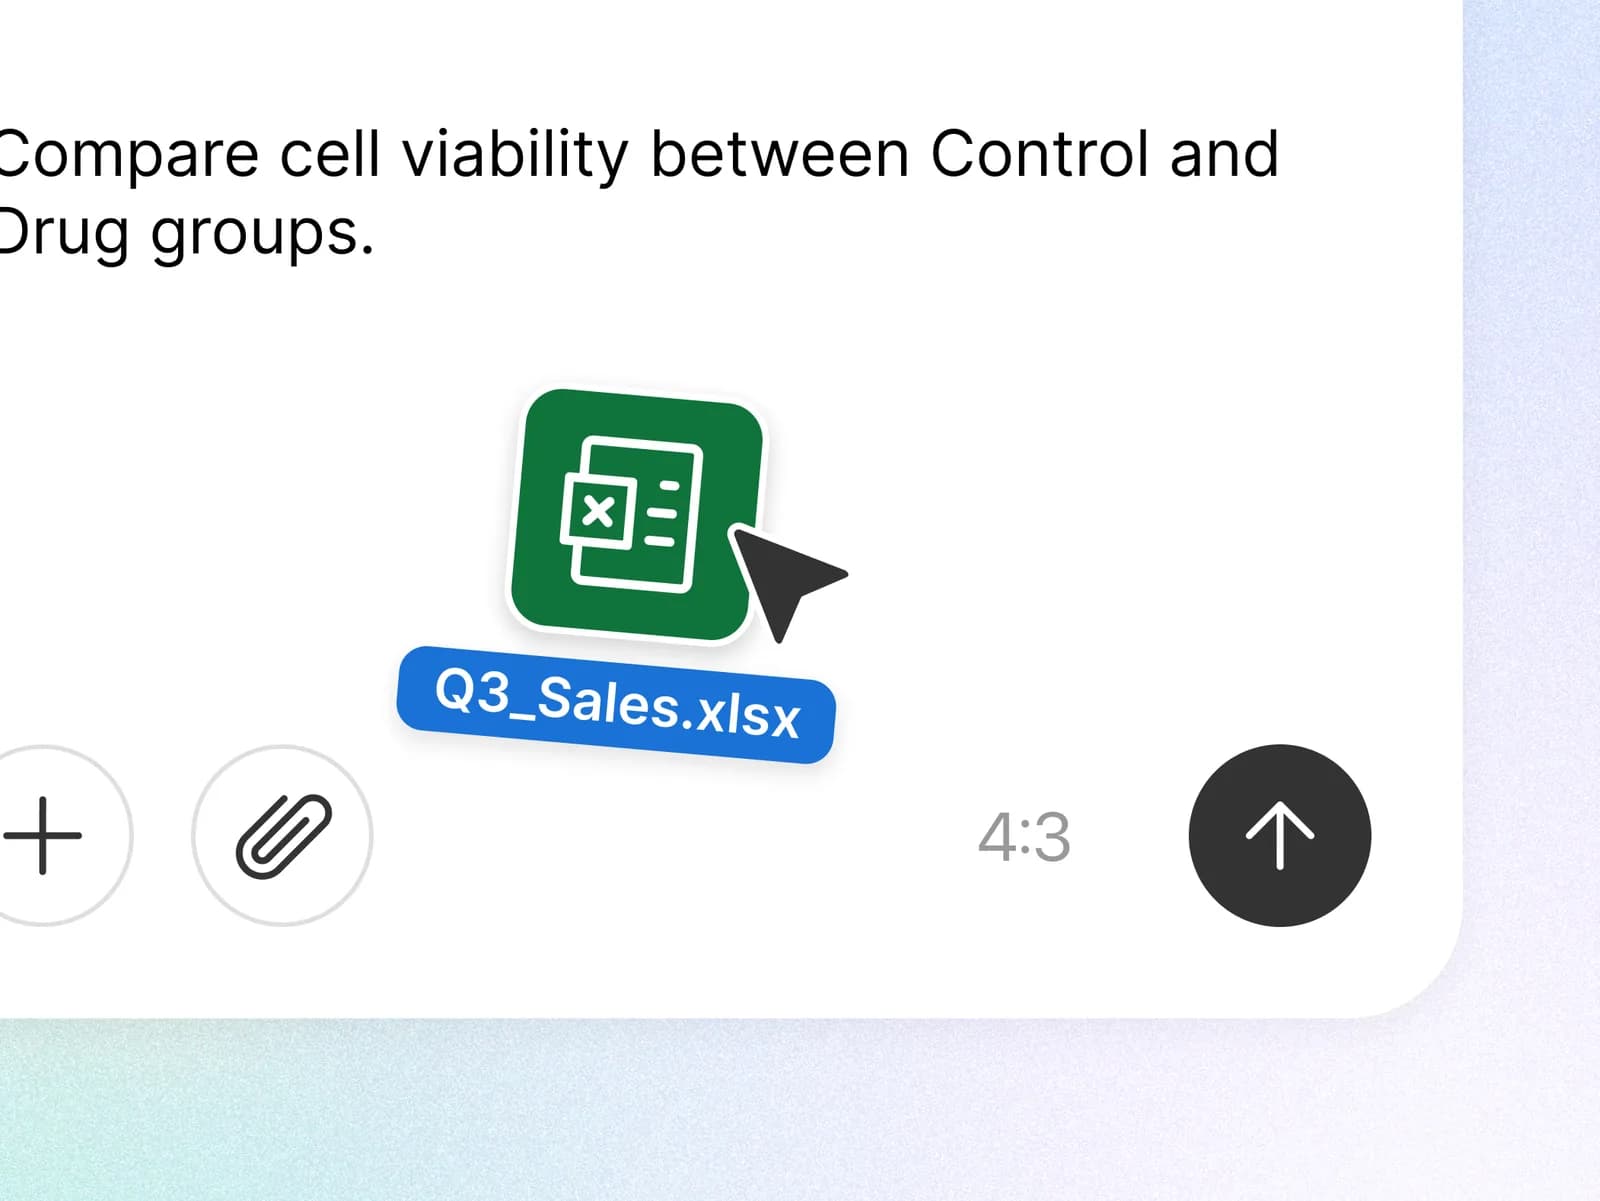
    Prompt comparing cell viability, with an Excel spreadsheet attached
  2. 使用 AI 精調每個細節

    透過簡單對話修改標籤、座標軸、顏色、標註、圖表類型和版面。
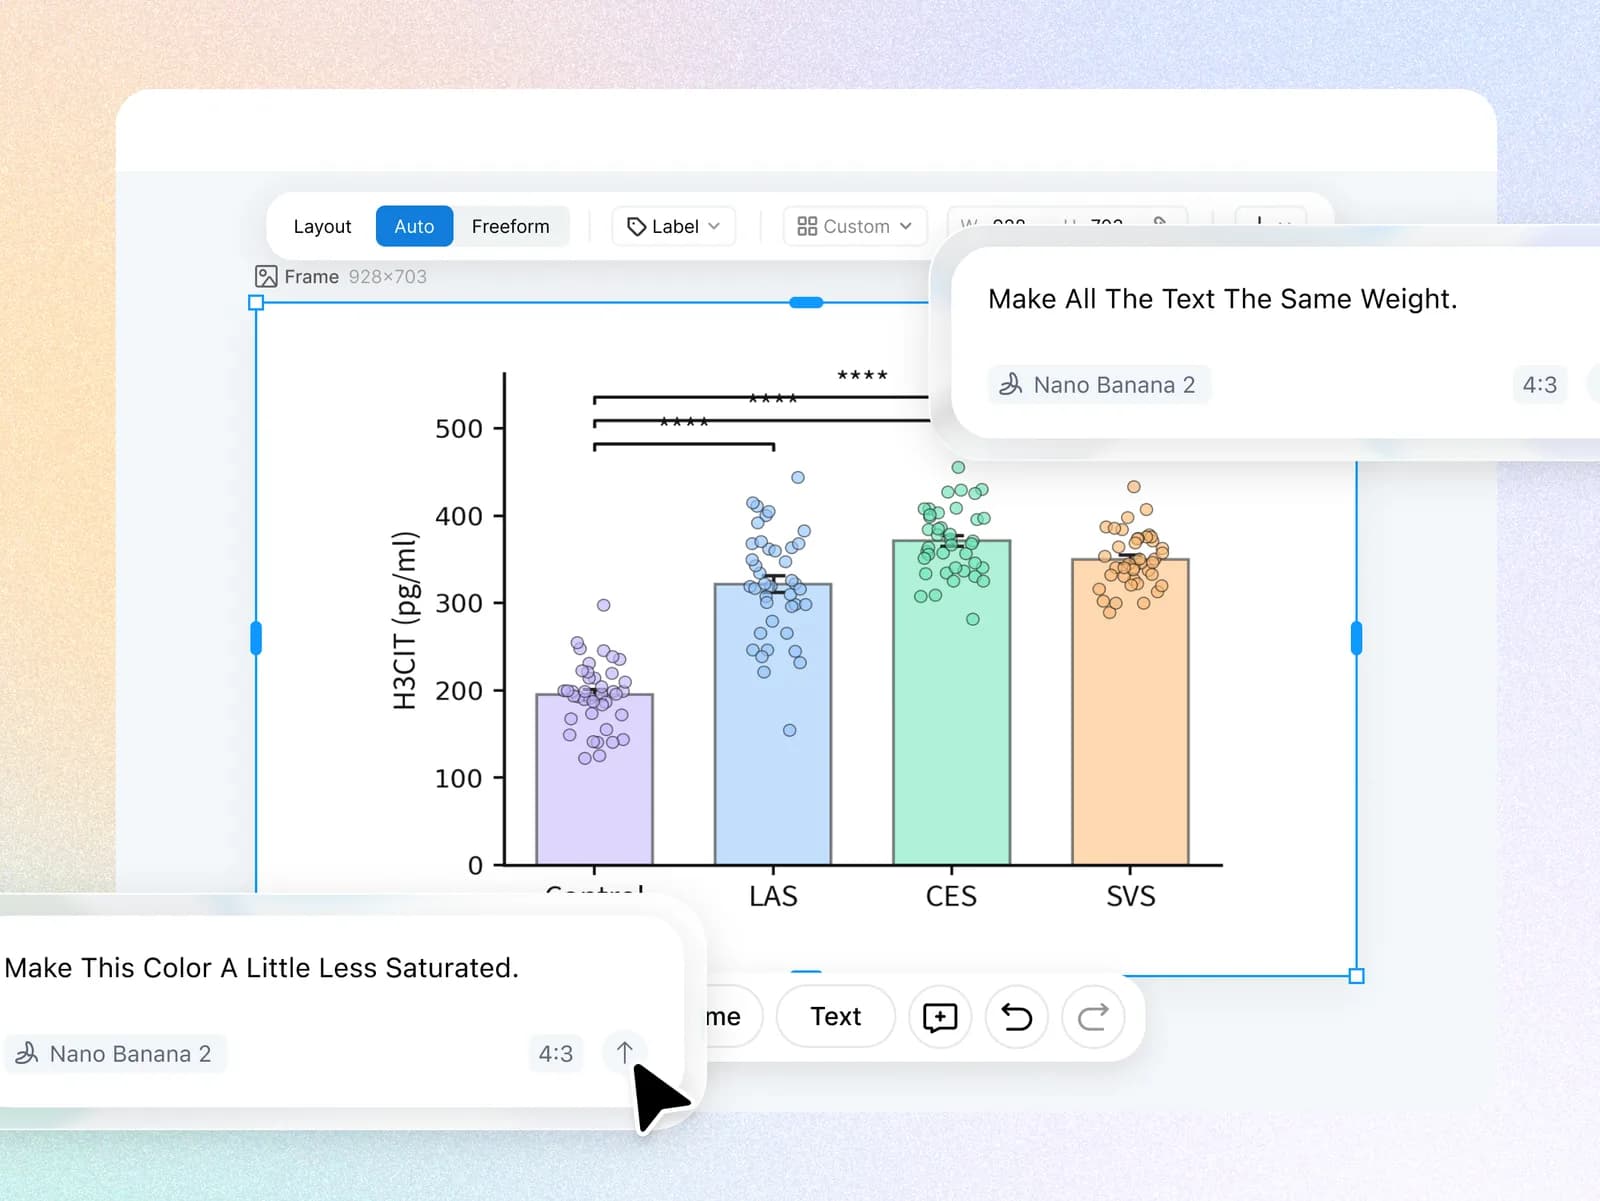
    H3CIT bar plot with chat prompts to match text weight and desaturate a color
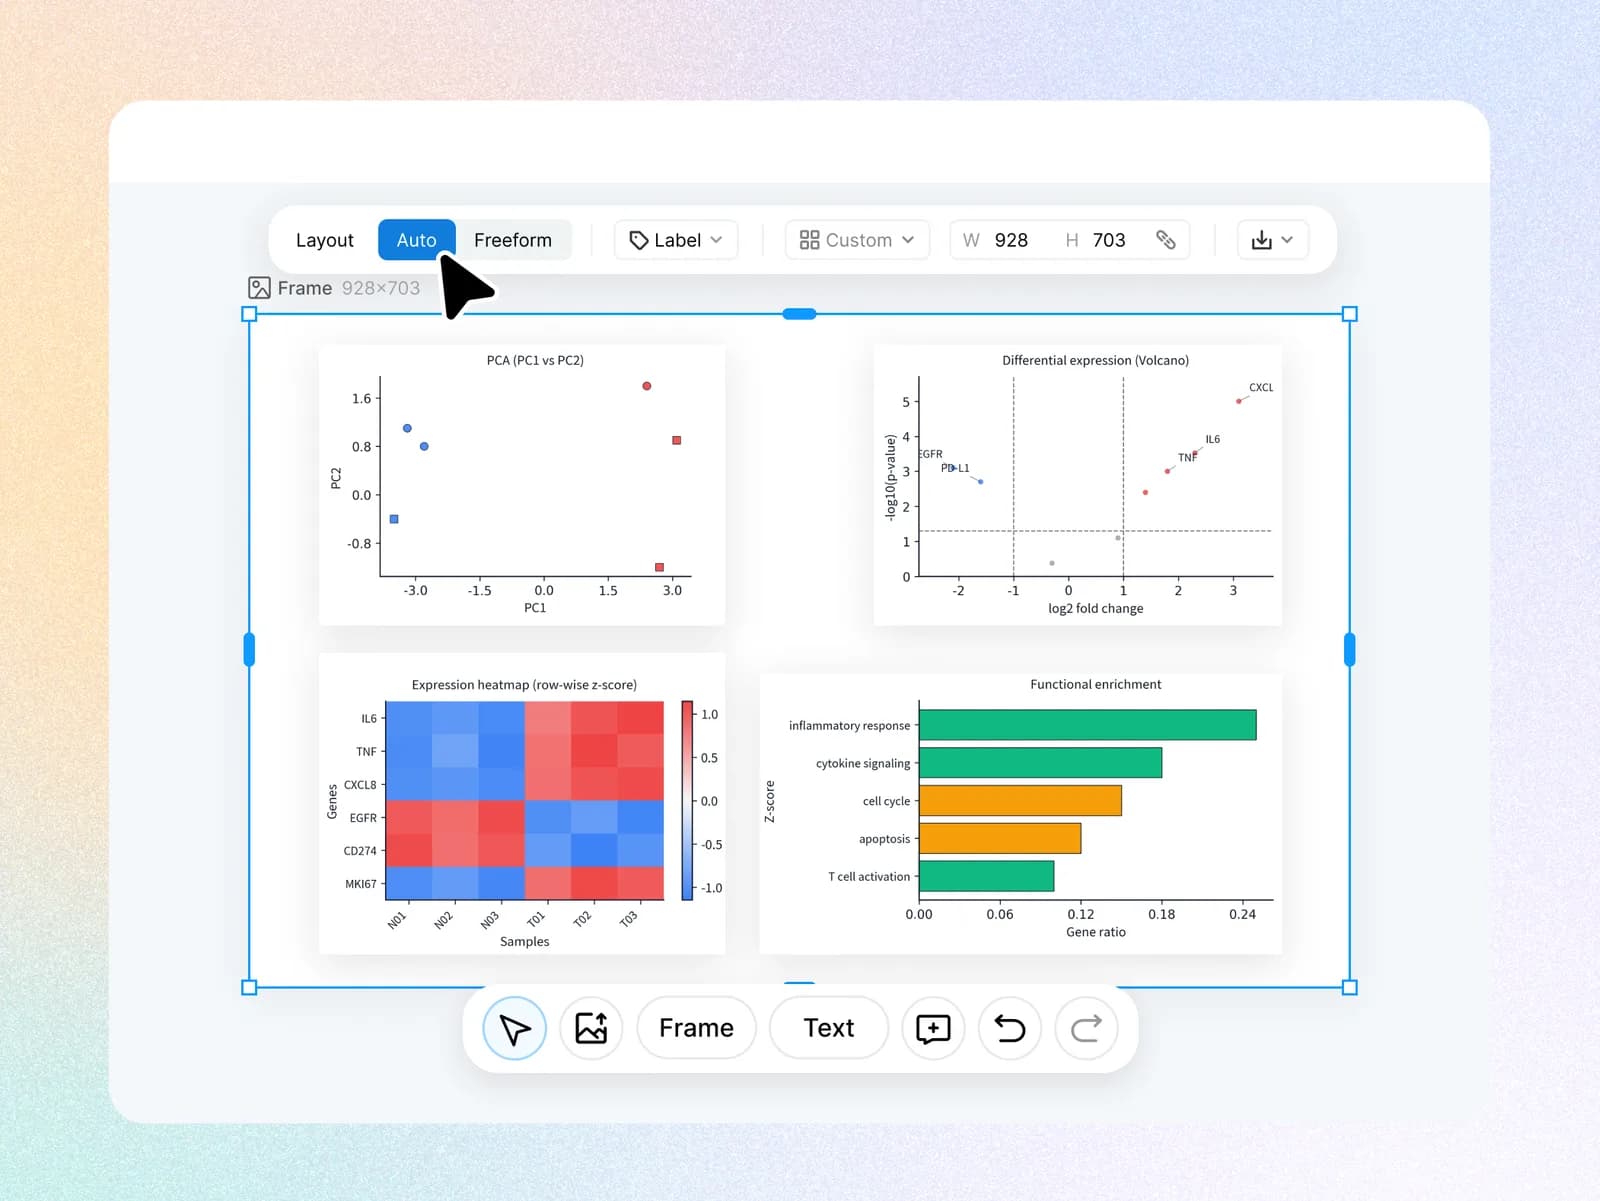
  3. 建立多面板科學圖

    在無限畫布上排列和對齊多個資料圖,組成多面板科學圖。

    Four-panel figure with a PCA plot, volcano plot, expression heatmap, and enrichment chart
  4. 可供發表

    匯出 PNG、JPG、SVG、PPTX 或下載 Python 程式碼,並可獲取發表授權證書。
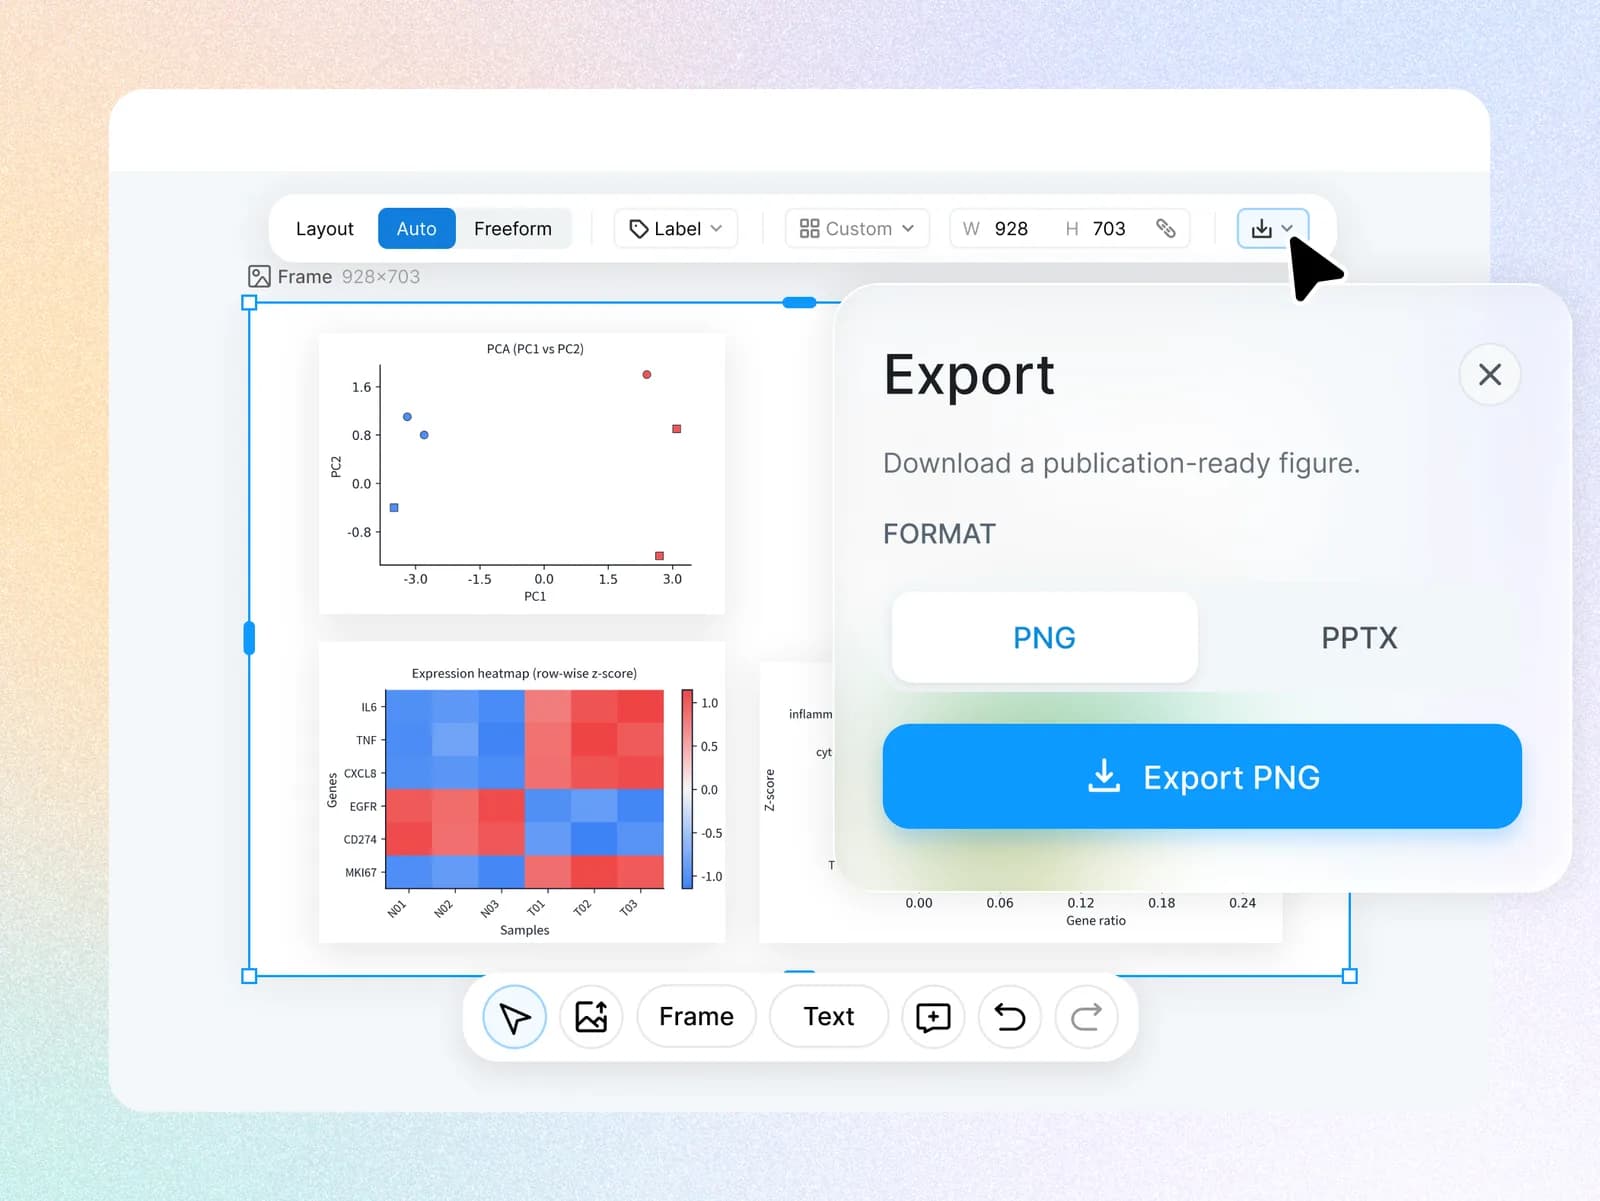
    Export dialog over a multi-panel omics figure, with PNG selected

適用對象

  • Fifi mascot as an engineer with a tablet and robotic arm

    體學與生物資訊學研究人員

    火山圖、熱圖、PCA 圖、富集分析圖

  • Fifi mascot as a lab scientist holding a test tube

    實驗科學家

    箱形圖、散佈圖、劑量反應曲線、時間序列圖

  • Fifi mascot as a doctor with a stethoscope

    臨床研究人員

    Kaplan-Meier 曲線、森林圖、ROC 曲線、瀑布圖

探索更多 AI 科學圖生成器